
Tinkering with Mean and Median
Aim
Investigate, using dot plots and counters, how the mean and the median of a collection change when values are included or removed, and how they behave when every value is increased, decreased or multiplied by a fixed number.
Apparatus
- A printed or hand-drawn number line strip from 0 to 35 (one per group)
- Counters, bindis, buttons or sticker dots to place on the strip
- Paper slips, one data value written on each
- Coloured pens, a ruler and a notebook
- A calculator (optional, for checking only)
Procedure
- Put one counter above each of 5, 7, 8, 8, 12 on the strip. Find the mean and the median and record them.
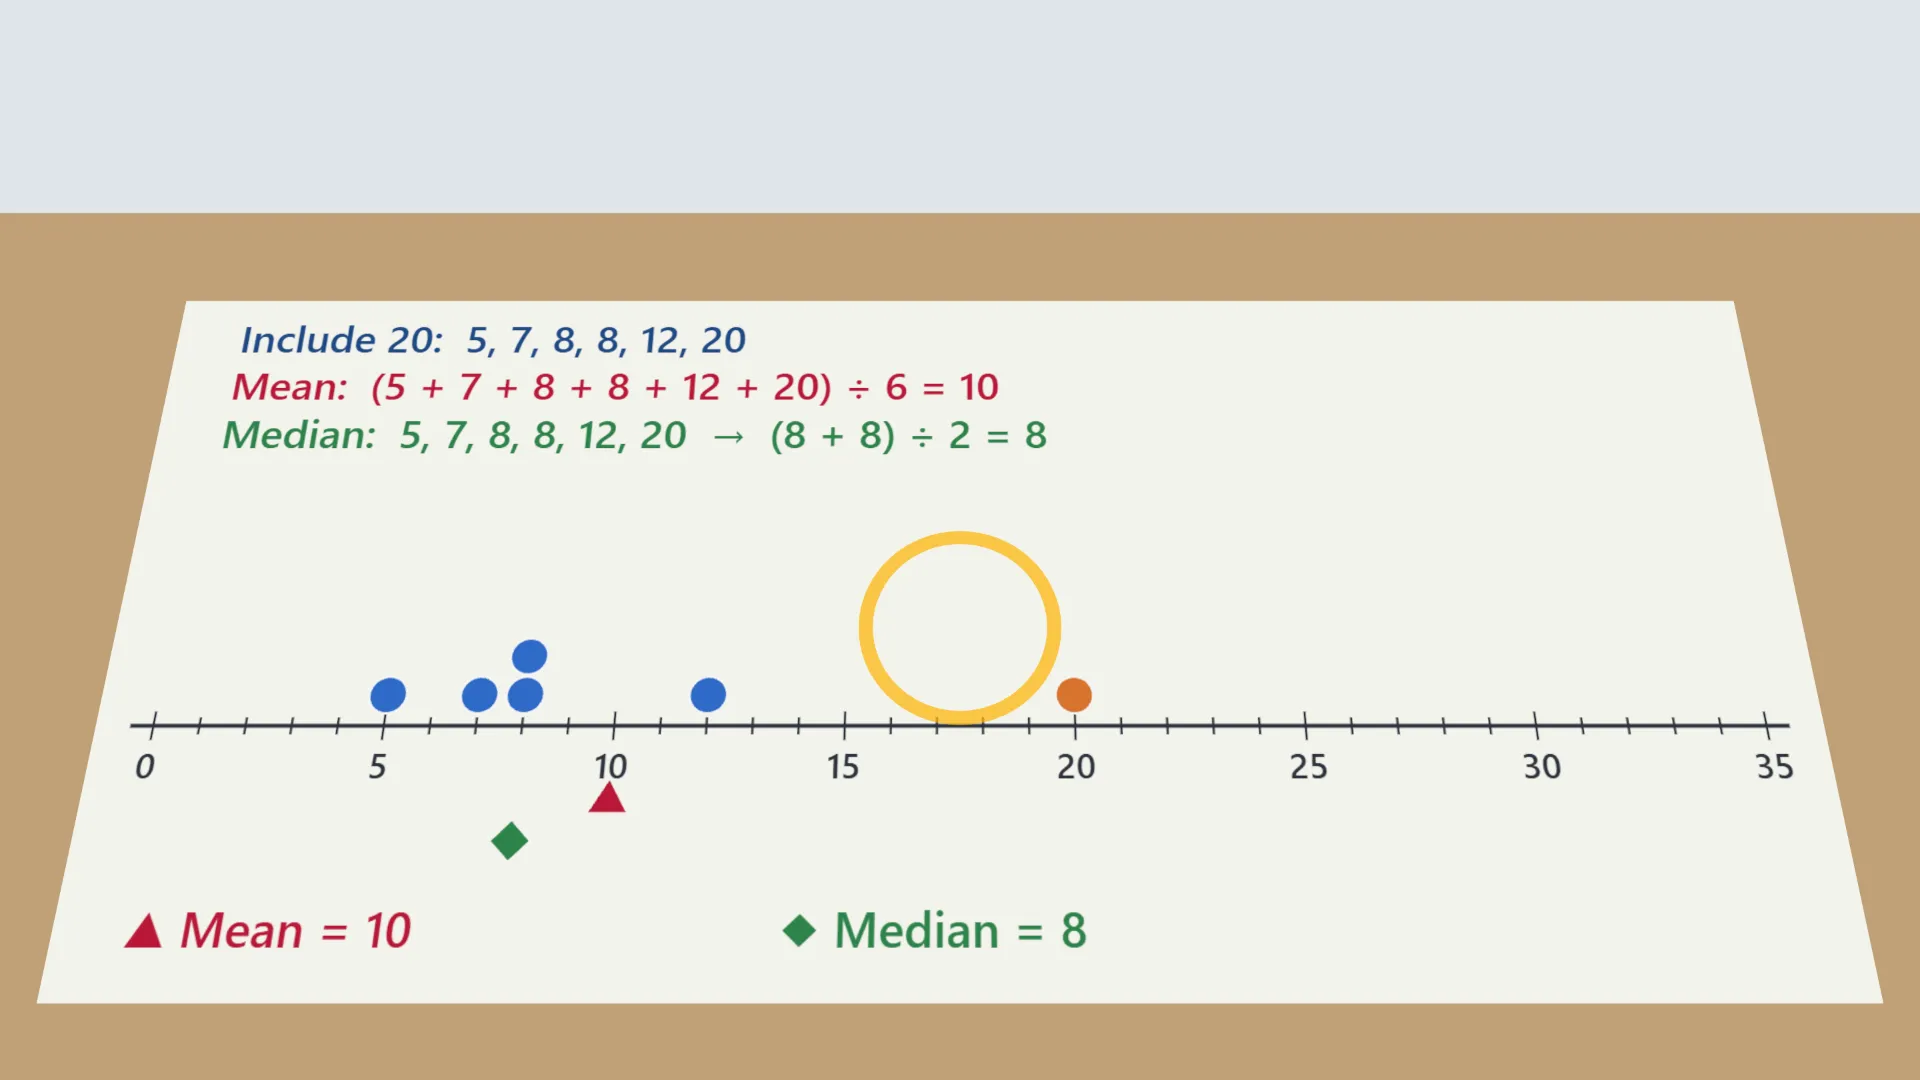
- Include 20 with a counter of a new colour. Recalculate the mean and the median.
- Remove 20 and include 2 instead. Record the new mean and median.
- Include a value equal to the mean, 8. Note what happens to the mean and, separately, to the median.
- Go back to the original data. Remove 12 and record; restore it and remove 5 instead.
- Find two values, then three values, that can be included without changing the mean. Give two solutions for each.
- Slide every counter 10 steps right (add 10), then subtract 3. Predict the new mean first, then check.
- Double every value and place the counters afresh. Predict, then check. Also multiply by 5. Record in Table 2.
- Use algebra to say what happens to the mean when k is added to every value, and when every value is multiplied by k.
Interactive 3D Experiment
Loading simulation…
What to observe
- Including a value greater than the mean raises the mean, while the median moves little or not at all; a smaller value lowers it.
- Including a value equal to the mean leaves the mean unchanged. Two values can be included without changing the mean if their total is twice the mean.
- Adding 10 to every value adds 10 to the mean and the median; multiplying every value by a number multiplies both by it.
- The mean responds to every value and is pulled by extreme values; the median depends only on the middle of the ordered data.
Notes
- Math Spark: a single extreme value can drag the mean a long way but hardly moves the median. This is why reports on income usually quote the median: one very rich resident can lift the mean income of a whole town, while the middle person’s income stays where it was. ‘Median’ comes from the Latin medianus, ‘in the middle’.
- Arrange the values in ascending order before finding the median, every time the data changes.
- When the number of values is even, the median is the average of the two middle values, not either one of them.
- Recalculate the mean with the new number of values; dividing by the old count is a common error.
- Place each counter exactly above its value on the strip, stacking counters for repeated values.
- Use a different colour of counter for each newly included value so that the change can be traced.
- Predict the new mean before calculating it, and only then check.
- Return to the original data set before starting each new investigation.
- Use the calculator only for checking, after the arithmetic has been done by hand.