
The Balancing Act
Aim
Locate the mean of a collection of data on a number line using dot plots and a physical balance model, and verify that the sum of the distances of the values to the left of the mean equals the sum of the distances to its right.
Apparatus
- Graph paper or a dot-grid notebook, ruler and pencil
- Coloured sketch pens (at least three colours)
- A 30 cm wooden or plastic scale and a round pencil (or a small cylinder) to act as a fulcrum
- About 20 identical coins, washers or bottle caps to serve as equal weights
- Small paper slips and sticky notes for writing data values
Procedure
- On graph paper, draw a number line from 0 to 15, marking every whole number.
- Mark 3 and 7 as dots. Calculate their mean, mark it with a cross, and measure the distance of each dot from it.
- Try other pairs of your own. Note where the mean lies with respect to the two dots.
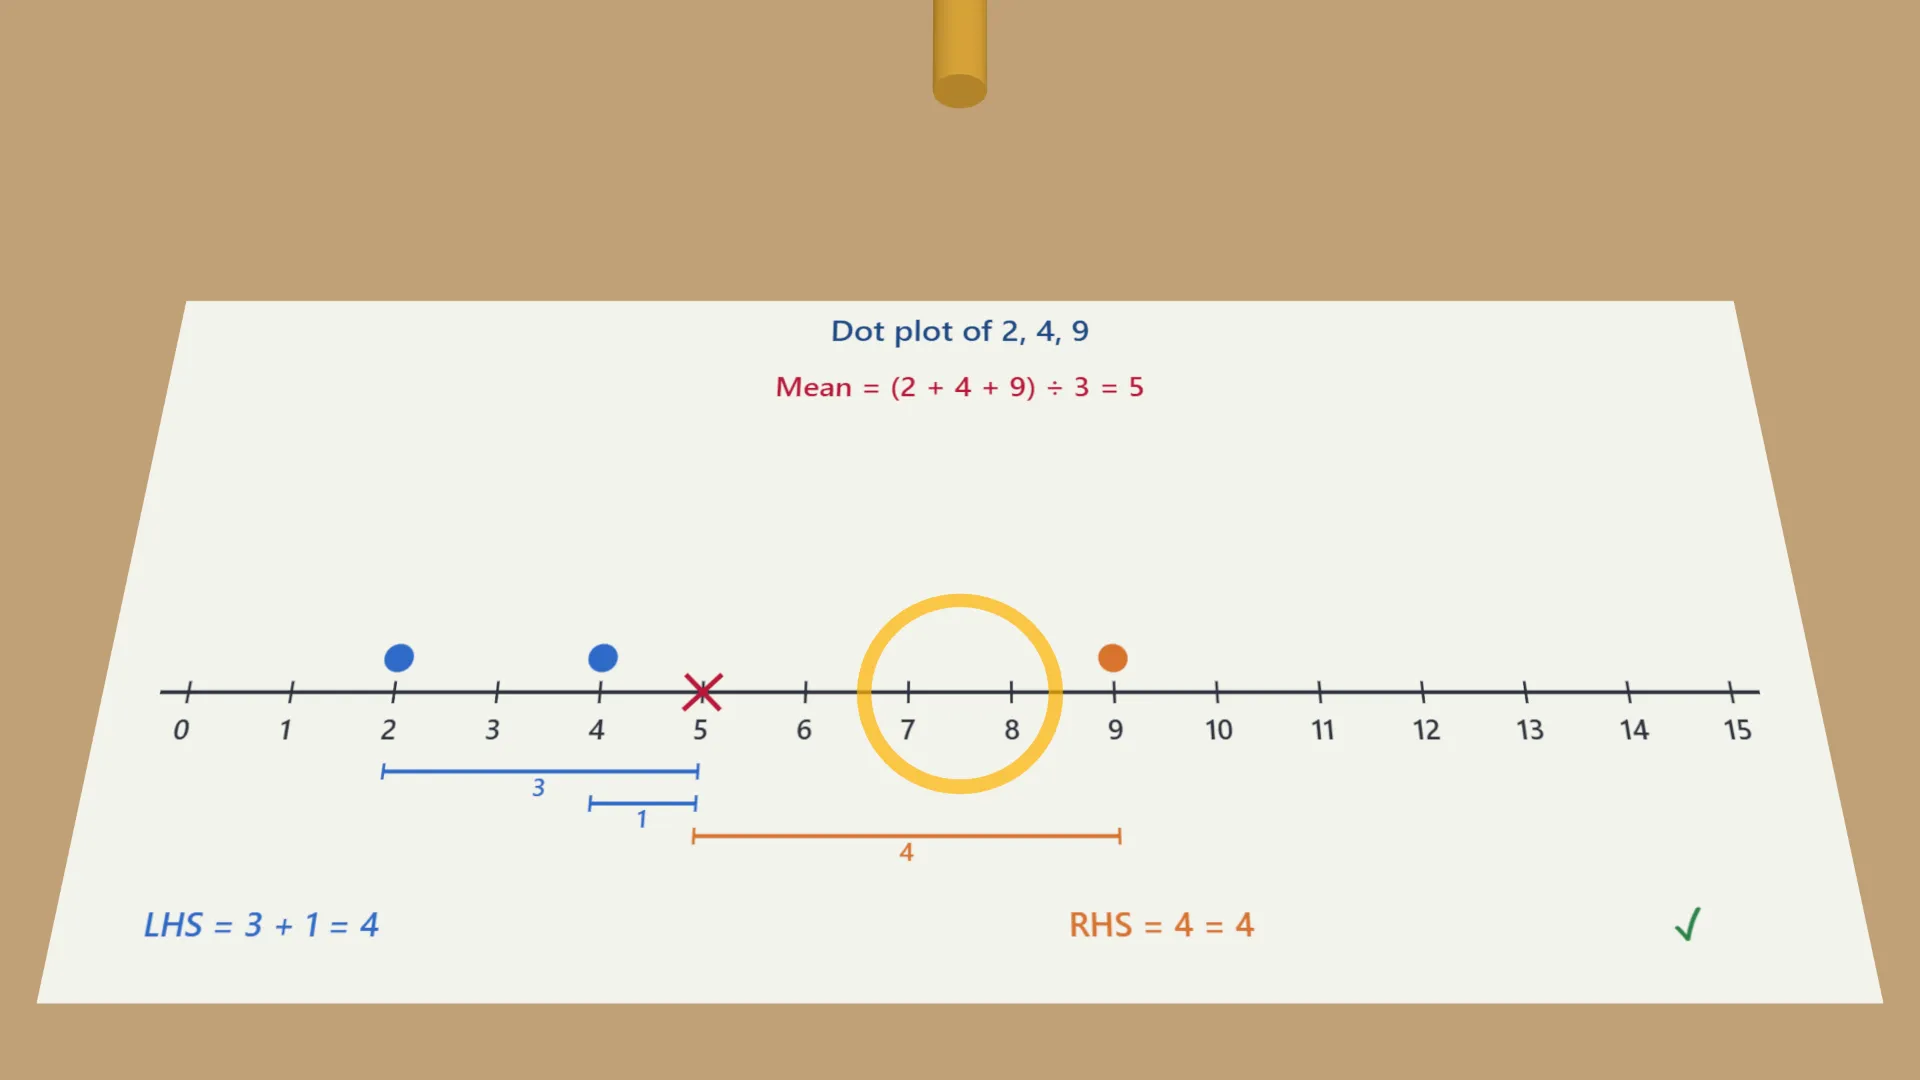
- For 6, 7, 8 then 3, 6, 9 then 2, 4, 9 then 4, 6, 6, 12, mark the dots and the mean. Record the LHS and RHS sums.
- Rest the 30 cm scale across the round pencil like a see-saw. Its cm marks are your number line.
- Put one coin on each mark of 3 and 7. Slide the pencil until the scale balances and read the mark. Compare it with the mean.
- Repeat for 10, 10, 11 and 17, with two coins at 10. Record the balancing point.
- Move the pencil to a trial centre a little larger than the mean, 13, and find the LHS and RHS sums again.
- Why can a collection of data have only one balance point?
Interactive 3D Experiment
Loading simulation…
What to observe
- For every collection the total distance of the values left of the mean equals the total distance of those right of it.
- The scale balances with the pencil at the mark equal to the mean: the mean is the balance point of the data.
- At a trial centre larger than the mean the two sums are unequal (8 and 4 for 13), so there is only one balance point. The mean always lies between the smallest and the largest value.
Notes
- Math Spark: the mean is sometimes called the centre of gravity of the data. Physicists use the same calculation to find where a see-saw balances: a data value far from the centre behaves like a child sitting far from the pivot. The word ‘average’ comes from the Arabic ‘awariya’, used by medieval traders for goods damaged at sea; the loss was shared equally among all the merchants.
- Use coins, washers or caps that are identical in weight; unequal weights shift the balance point.
- Place each coin exactly on its centimetre mark, and stack coins one above the other when a value is repeated.
- Rest the scale on a round pencil so it can tip freely, on a flat, level surface.
- Slide the pencil slowly and let the scale settle before reading the balance point.
- Read the balancing mark to the nearest millimetre and accept a small difference from the calculated mean as experimental error due to friction and the weight of the scale itself.
- Mark the mean with a cross above the number line, distinct from the data dots.
- Measure the distance of each value from the mean as a positive distance, and add the left and right sums separately.
- Keep the number line evenly scaled — every unit must occupy the same length.