
Seeing the Distributive Property
Aim
Model a(b + c) = ab + ac with dot arrays and grid paper, build the identity (a + m)(b + n) = ab + mb + an + mn, and use it to predict how a product changes when the numbers are increased or decreased.
Apparatus
- Dot grid or graph paper notebook
- Coloured pencils or sketch pens (at least 4 colours)
- Ruler, pencil and a pair of scissors
- About 60 counters, beads, bottle caps or tamarind seeds per group
- Chart paper for displaying the group's final array
Procedure
- Draw an array of 5 rows and 10 columns. Split it after the 6th column and count each block. Write 5(6 + 4) = 5 × 6 + 5 × 4.
- Repeat with two arrays of your own. Write a(b + c) = ab + ac and colour the two blocks differently.
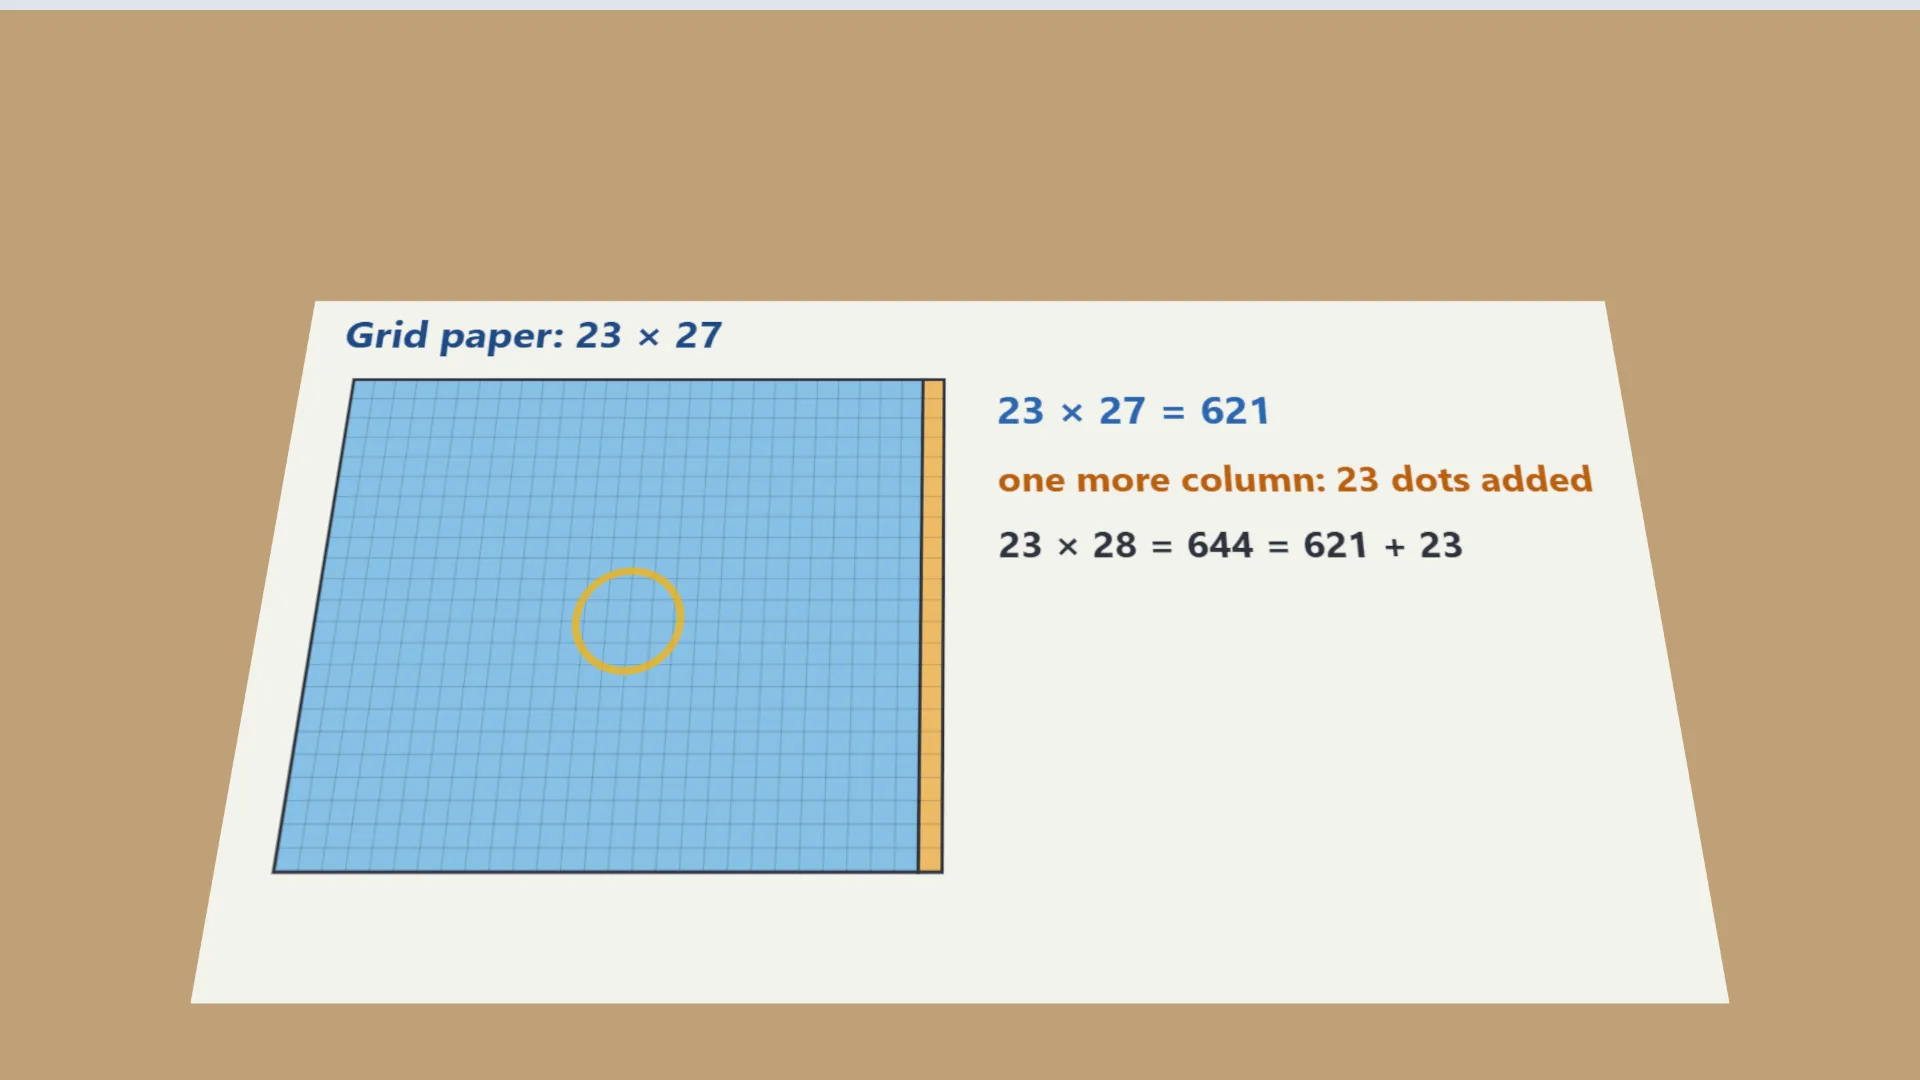
- Build 23 × 27 on grid paper. Add one extra column in a new colour. How many dots were added?
- Add one extra row in a third colour. Mark the four regions and record the total increase.
- Rub out one column instead, to show (23 + 1)(27 − 1). Did the product increase or decrease, and by how much?
- Draw the four-block figure for (a + m)(b + n). Label ab, mb, an, mn and write Identity 1.
- Use Identity 1 with negative values to expand (a + u)(b − v), (a − u)(b + v) and (a − u)(b − v).
- Check every result in the observation table by multiplying the two numbers.
Interactive 3D Experiment
Loading simulation…
What to observe
- An array split into two blocks has the same number of dots counted whole or in parts, so a(b + c) = ab + ac.
- Splitting both sides gives four rectangles ab, mb, an, mn, which is Identity 1.
- Adding one to a number adds the other number to the product. Taking one away takes it off.
- When both numbers decrease the mn block is added back, so the sign of mn is positive.
Notes
- Math Spark: Brahmagupta (628 CE) called multiplication by parts khanda-gunanam: break the multiplier into parts, multiply each part, then add. In a 3 × 3 frame of a multiplication grid with pq in the middle, the corners are (p ± 1)(q ± 1).
- Space the dots evenly and keep rows and columns aligned, or the rectangles will not match the numbers.
- Cut only along the grid lines, into four rectangles that neither overlap nor leave gaps.
- Use a different colour for each of the four regions and label it with its own product.
- Check that the four part-counts add up to the total count before writing the identity.
- Keep track of which letter stands for a row-count and which for a column-count.
- Be careful with signs when a number is decreased. A subtraction makes the mn term positive, as in (a − m)(b − n).
- Handle scissors with care and keep the cut pieces together on the chart paper.