
Representing Data with Pictographs
Aim
Show a frequency table as a pictograph, using a symbol and a key (scale), and read the pictograph to answer questions. Then redraw it on a larger scale and see which scale is easier.
Apparatus
- Graph or chart paper and a pencil
- Ruler, eraser and coloured sketch pens
- A stamp, sticker or simple symbol that is easy to draw (a smiley, a triangle, a kite)
- A data table to represent (from Practical 1 or the example)
Procedure
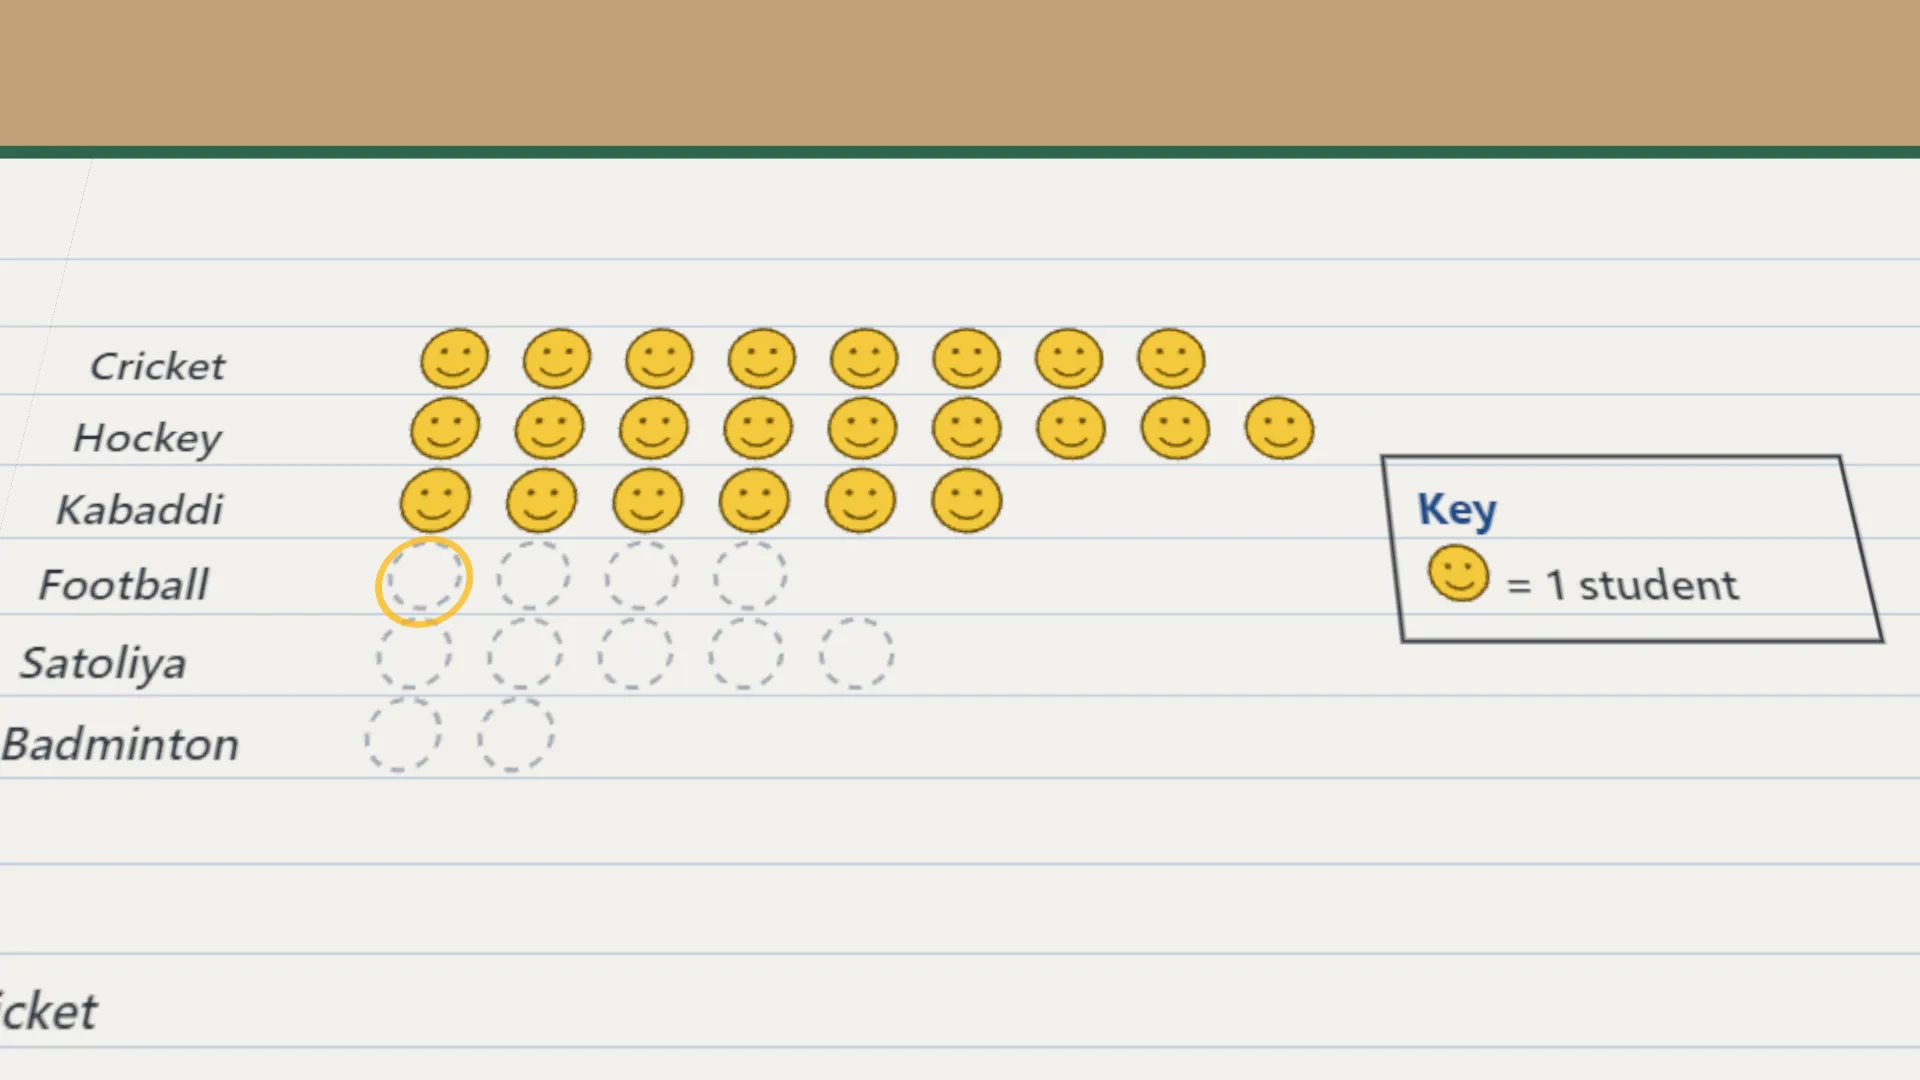
- Decide the key first. One smiley stands for 1 student. Write it beside the pictograph.
- Draw as many smileys as each game's frequency, equally spaced and in line.
- Check each row. The number of smileys must match the frequency in the table.
- Redraw the same data on a larger scale. Write the new key first, 1 smiley = 5 students.
- Draw whole smileys, and a part smiley in true proportion for what is left over.
- Check each row again and write what its smileys stand for in the table.
- Read both pictographs and compare which scale is easier to draw and to read.
Interactive 3D Experiment
Loading simulation…
What to observe
- Which game is the most popular, and which is the least popular?
- Which scale needs fewer symbols? Which shows every value exactly?
- When is a part symbol needed?
Notes
- A pictograph tells its story at a glance. Our eyes compare rows of pictures faster than columns of numbers.
- Choosing the scale is the clever part. If one symbol = 10 people, 25 people is two whole symbols and half a symbol.
- Decide the key first and write it beside the pictograph before you draw any symbol.
- Choose a simple symbol and keep every symbol the same size.
- Keep the symbols equally spaced and in line, so the rows can be compared fairly.
- Draw a part symbol in its true proportion. Half a symbol must look like half.
- Do not change the scale in the middle of a pictograph.
- Label each row, and re-check the number of symbols against the frequency table.