
Constructing a Relief Profile of India from the Himalayas to the Coast
Aim
To construct a simple relief profile (cross-section) showing how the height of the land changes from the Himalayas in the north to the coastal plains in the south, and to interpret it.
Apparatus
- Graph paper
- Pencil
- Ruler
- A physical map of India with a height legend
- An atlas or a teacher-provided elevation reference table
Procedure
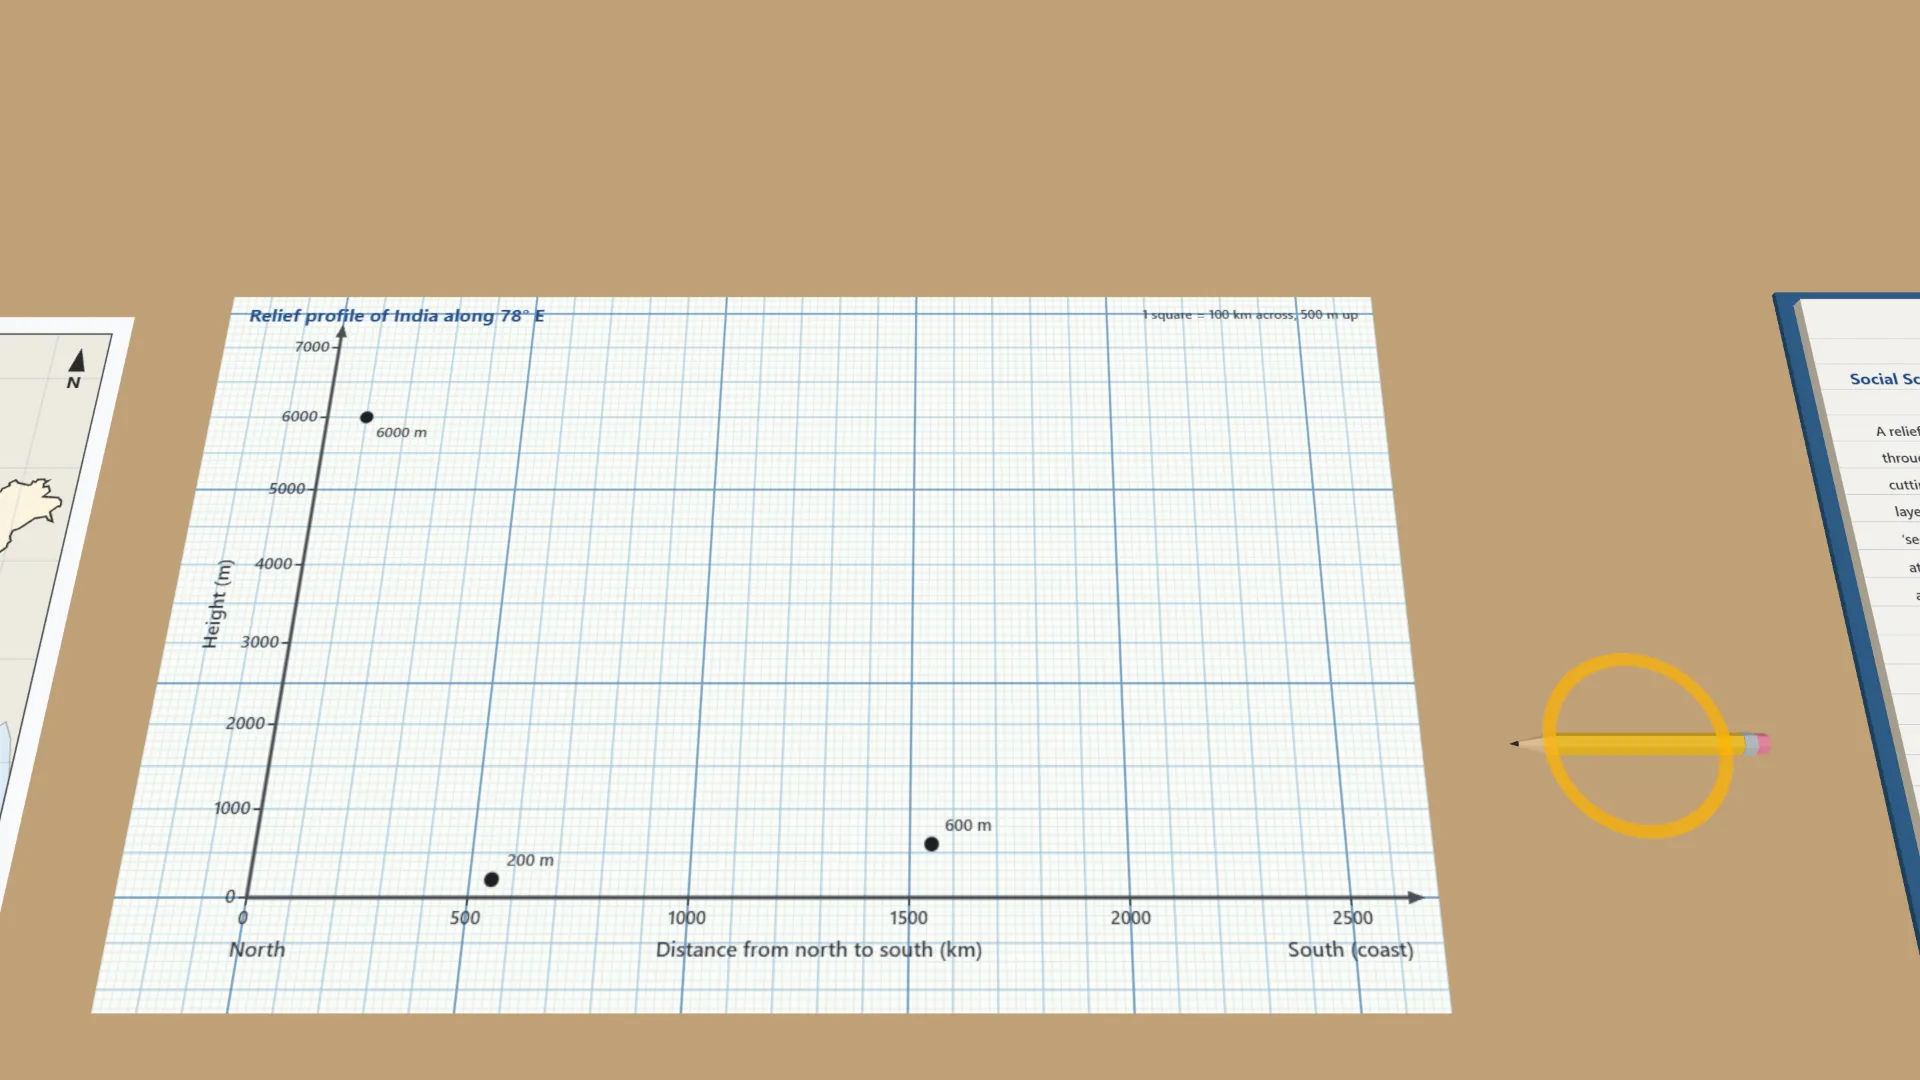
- On graph paper, draw a horizontal axis for distance (north to south) and a vertical axis for height (m).
- Note the approximate height of each feature along a north–south line on the map.
- Plot a point for each feature at its height, spaced by its distance along the line.
- Join the points with a smooth line to form the relief profile.
- Label each part of the profile with the name of its physical feature.
- Discuss with a partner which parts of India are the highest and which are the lowest.
Interactive 3D Experiment
Loading simulation…
What to observe
- The Himalayas are by far the highest part of the profile, at about 6000 m.
- The land drops to the low Northern Plains, rises again to the Peninsular Plateau, and falls to the Coastal Plains near sea level.
Notes
- A relief profile is like a slice through the land, like cutting into a cake to see its layers. It shows the shape of the land at a glance.
- Keep a consistent scale on both axes, label every part clearly, and use a ruler to draw straight axis lines.