
Reading a Weather Report — Interpreting Meteorological Data
Aim
To read real weather data from an IMD chart and prepare a short weather report on the temperature range, humidity and precipitation of different places.
Apparatus
- Science notebook (lab record) and pencil
- A real weather data chart: the IMD Srinagar chart of 8 November 2026 for Jammu & Kashmir
- Calculator (optional, for the temperature range and averages)
- Chart paper and sketch pens
Procedure
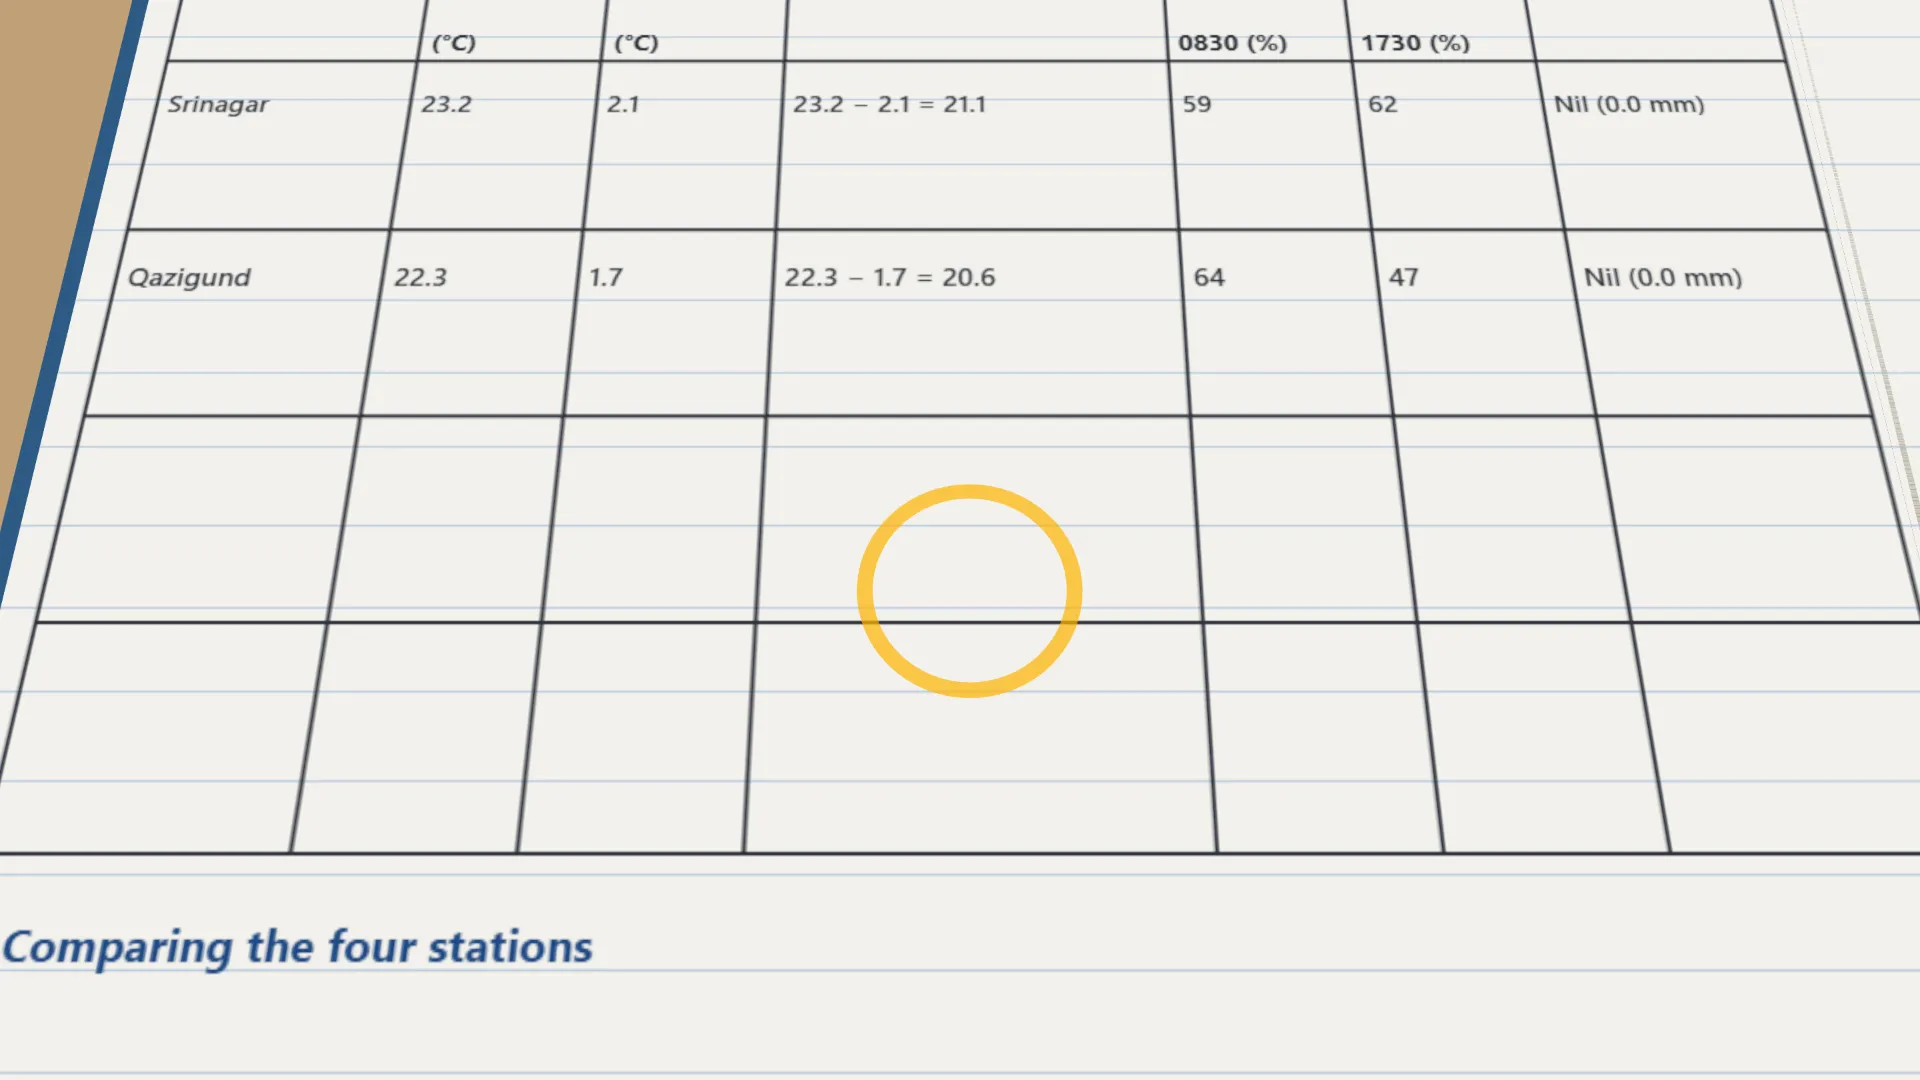
- In pairs, choose four stations from the weather data chart.
- Note each station's maximum and minimum temperature. Range = maximum − minimum.
- Note the relative humidity at 0830 hrs and at 1730 hrs for each station.
- Note the rainfall or snowfall of each station over the past 24 hours.
- Write a short weather report for each station, the way a news presenter would.
- Compare: which station was the coldest, which had the widest range, which was the most humid?
Interactive 3D Experiment
Loading simulation…
What to observe
- The hill stations, such as Gulmarg and Pahalgam, have much lower temperatures than Jammu.
- Places with the same kind of temperature can differ a lot in humidity.
- On 8 November 2026 no station had any rain or snow: a dry day all over Jammu & Kashmir.
Notes
- Social Science Spark: IMD gives its weather warnings in four colours, green, yellow, orange and red, so that anyone can judge at a glance how serious the weather is, from 'be updated' to 'take action'.
- The data is real: India Meteorological Department, Meteorological Centre Srinagar, Weather Parameters, 08-11-2026.