
Tracing the Journey of Goods: Mapping the Market Supply Chain
Aim
To put the people in a market supply chain in order, for a physical market and an online market, and to draw a flow diagram showing how goods move.
Apparatus
- Participant cards for Producer, Wholesaler, Distributor, Mandi or Warehouse, Retailer, Aggregator and Consumer
- A product scenario card
- Chart paper, sketch pens and a glue stick
Procedure
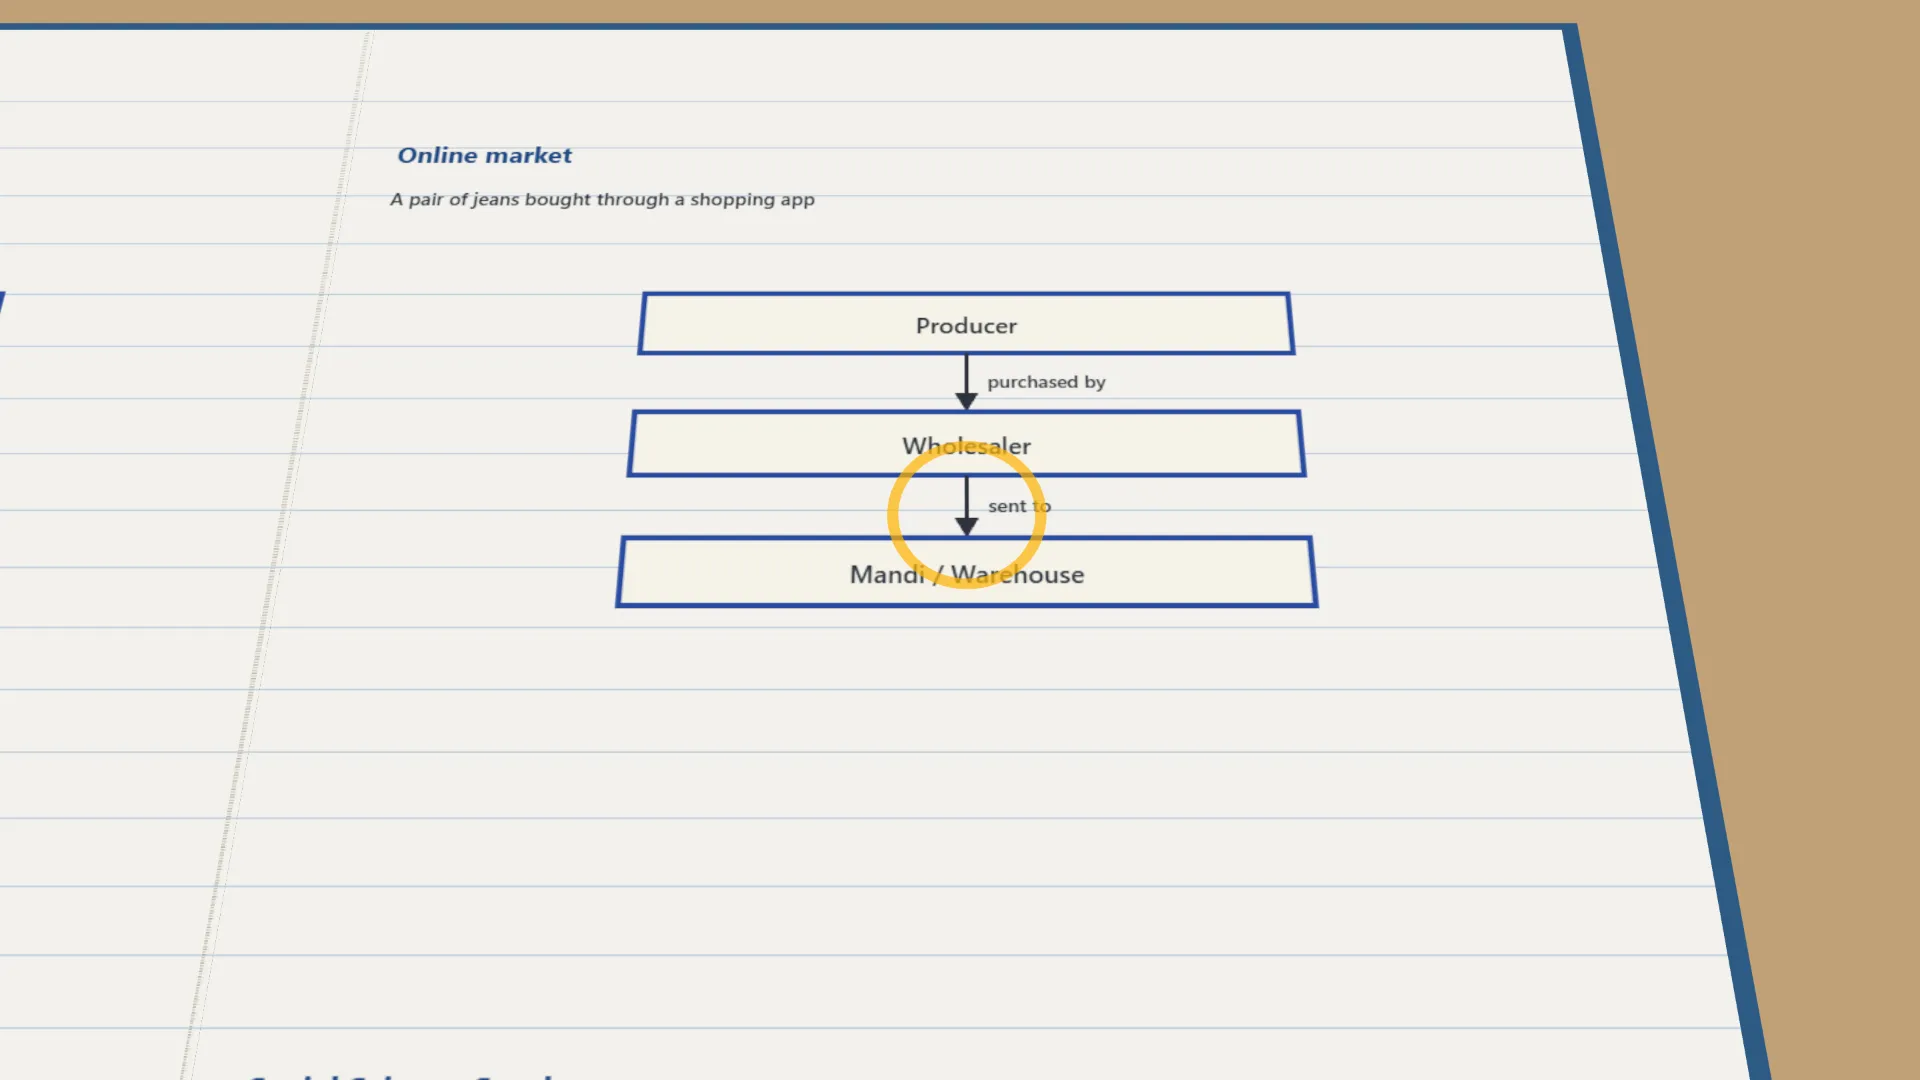
- In groups, take a set of participant cards and a product scenario. One is a bag of wheat flour from a local grocer, the other a pair of jeans bought through a shopping app.
- Read the scenario and talk about who brings the product from the producer to the consumer.
- Arrange the cards in the right order on chart paper and draw arrows showing which way the goods move.
- A physical market goes Producer, Wholesaler, Mandi or Warehouse, Retailer, Consumer. In an online market an Aggregator replaces the Retailer.
- Label each arrow with what happens, such as purchased by, sent to or delivered to.
- Present your diagram and explain the role of each participant in your own words.
- Record your sequence in the observation table.
Interactive 3D Experiment
Loading simulation…
What to observe
- In a physical market the goods reach the consumer through a retailer.
- In an online market an aggregator takes the retailer's place.
- The producer, wholesaler and mandi or warehouse come first in both.
Notes
- Social Science Spark: the Surat textile market in Gujarat is Asia's oldest textile market. Raw cotton travels from mandis to Surat's factories, where it is woven, dyed and made into garments. Wholesalers then send them to shopkeepers across the country and beyond.