
Mapping Chhatrapati Shivaji’s Kingdom and Its Forts
Aim
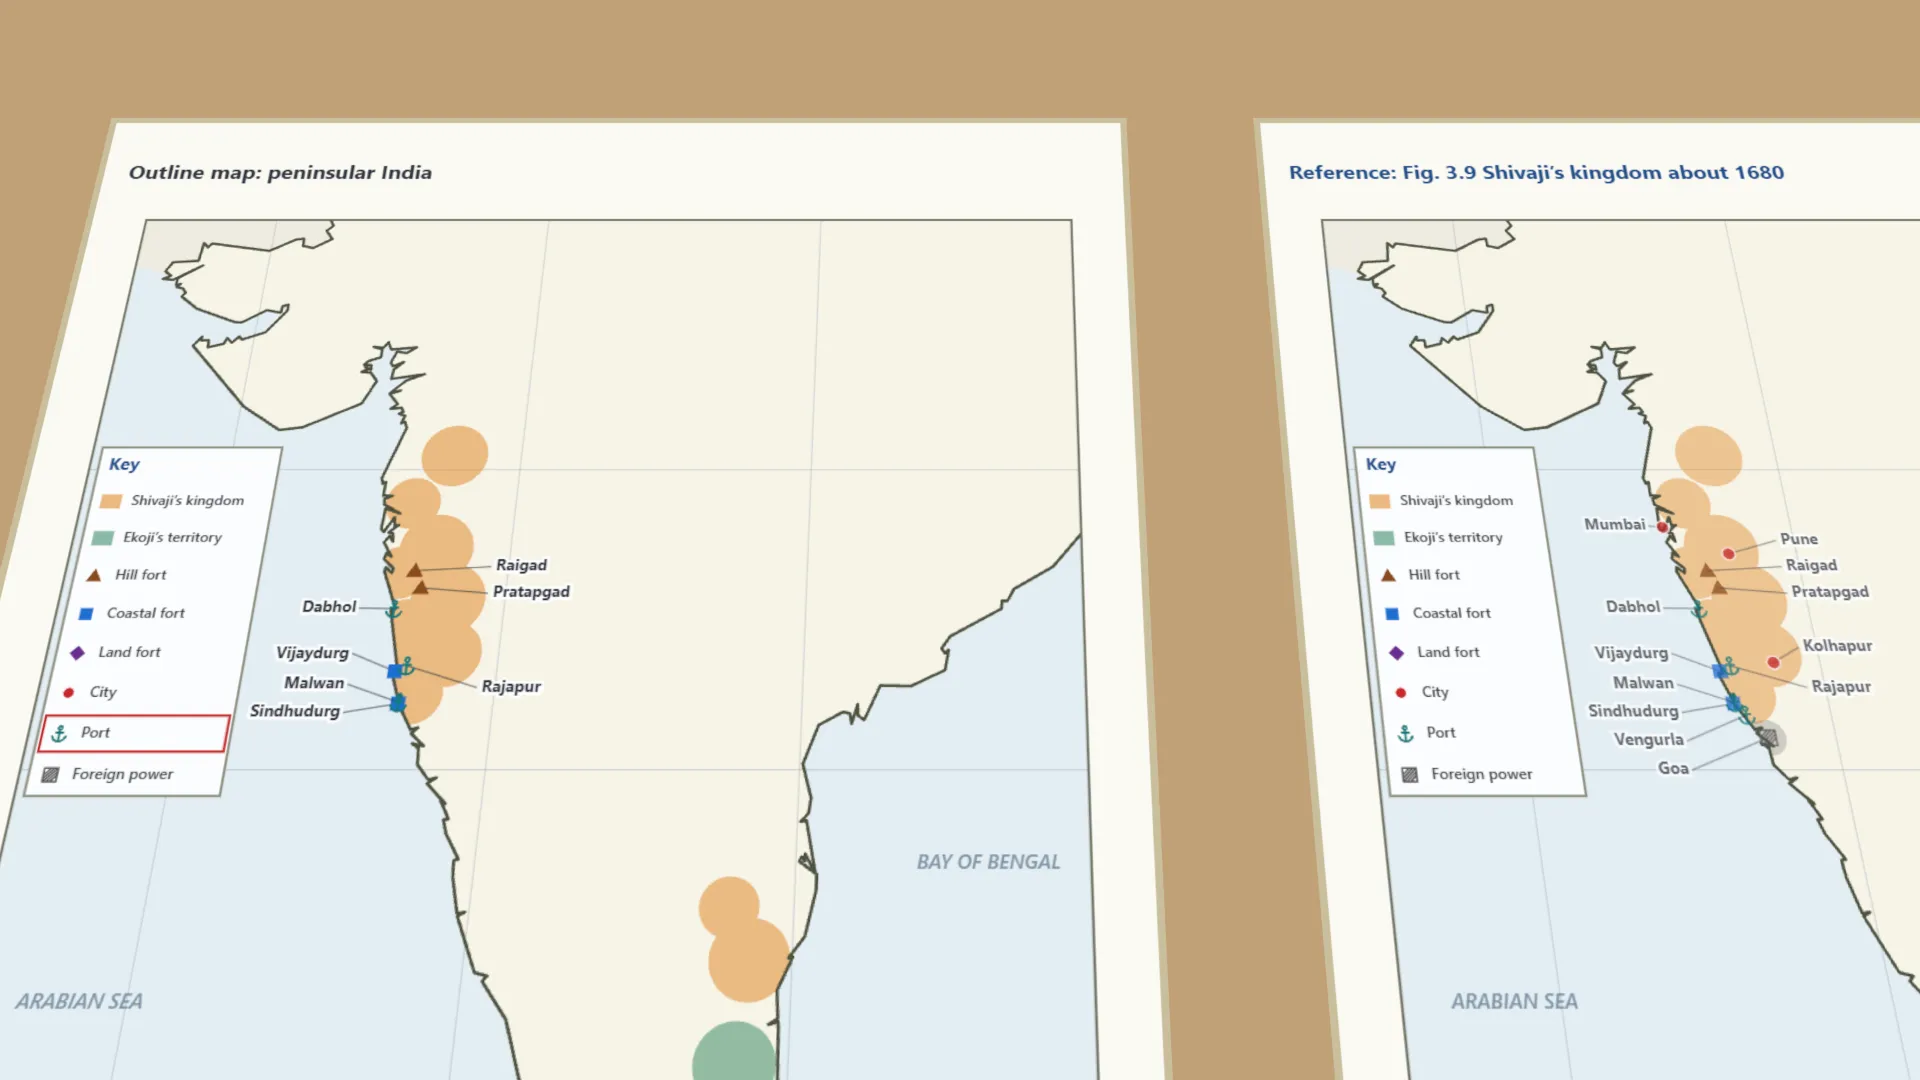
To locate and mark the forts, ports, cities and territorial extent of Chhatrapati Shivaji’s kingdom (around 1680) on an outline map, using a legend, and to classify the forts by type.
Apparatus
- An outline map of peninsular India (from Gujarat to Tamil Nadu)
- A pencil and coloured pencils
- An atlas or Fig. 3.9 of your textbook for reference
- A ruler
Procedure
- Study the reference map (Fig. 3.9) and its legend. Draw the same key on your outline map.
- Shade Chhatrapati Shivaji’s territory in one colour and Ekoji’s territory in another.
- Using the legend’s symbols, mark the hill forts Raigad and Pratapgad.
- Mark the coastal forts Vijaydurg and Sindhudurg, and the ports Dabhol, Rajapur, Malwan and Vengurla.
- Mark the land fort Vellore, the cities Pune, Mumbai and Kolhapur, and the Portuguese enclave of Goa.
- Record each place, its type and its present-day state or region in the observation table.
Interactive 3D Experiment
Loading simulation…
What to observe
- The kingdom had two separate parts - a long strip along the western coast and the Ghats, and Gingee and Vellore far south.
- Hill forts (Raigad, Pratapgad) guarded the Sahyadri hills; coastal forts (Vijaydurg, Sindhudurg) guarded the sea.
- Ports such as Dabhol, Rajapur, Malwan and Vengurla linked the kingdom to sea trade.
- Goa was held by a foreign power, the Portuguese. Thanjavur, further south, was Ekoji’s.
- Almost all the places marked are in present-day Maharashtra; Vellore is in Tamil Nadu.
Notes
- Social Science Spark: the kingdom had two clusters - one along the western coast and one far south near Gingee and Thanjavur. This ‘strategic depth’ later helped the Marathas withstand the Mughal invasion of the Deccan.
- Refer closely to the legend before marking symbols.
- Use pencil first and colour only after checking accuracy.
- Keep the map’s orientation (N-S-E-W) the same as the textbook map.
- The kingdom’s extent is approximate, following NCERT-level maps; the textbook’s Fig. 3.9 is not on the lab-manual page.