
Comparing World Map Projections
Mercator vs Robinson
Aim
Compare the Mercator and Robinson map projections and see how each one changes the size of land, using Greenland and India as examples.
Apparatus
- Outline maps in the Mercator and Robinson projections
- Tracing paper
- 1 cm graph paper
- Pencil
- Coloured pencils
Procedure
- Trace Greenland and India from the Mercator map.
- Place the tracing on graph paper and count the full and half squares each country covers.
- Repeat with the Robinson map.
- Record the counts and work out the Greenland : India ratio for each map.
- Compare the ratios with the real sizes. Greenland is smaller than India.
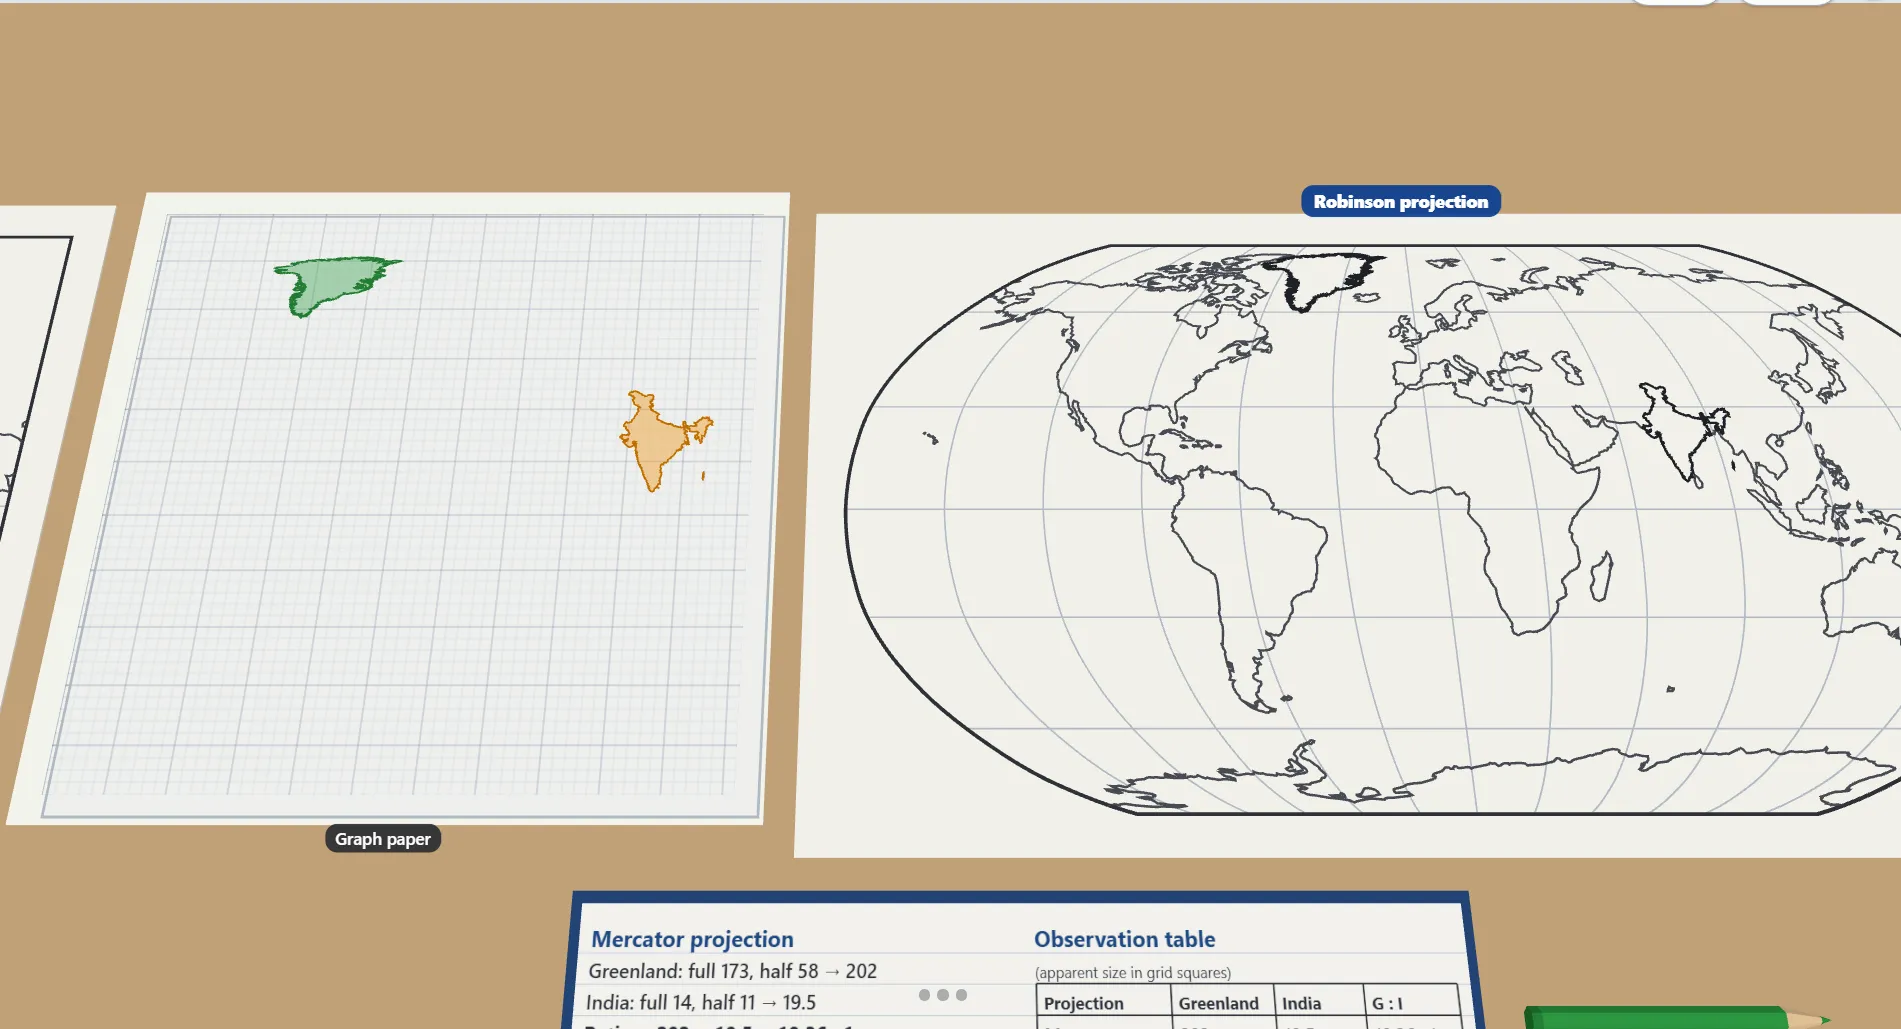
Interactive 3D Experiment
Loading simulation…
What to observe
- On which map does Greenland look much bigger than India?
- Which map's ratio is closer to the real one?
Notes
- The Mercator projection keeps directions and shapes true, so sailors have used it for centuries. But it stretches areas near the poles, so places far from the Equator, like Greenland, look much bigger than they really are.
- Line up the tracing paper with the squares carefully, and count part-squares the same way on both maps for a fair comparison.