
Experiencing the Power of Doubling
Aim
Fold paper to feel doubling (multiplying) growth, build a doubling table, and plot it on a graph next to adding the same amount each time (linear growth).
Apparatus
- Several large sheets of thin paper (newspaper or tissue works best)
- A ruler or measuring tape and a pencil
- A calculator
- Graph paper and coloured pencils (at least 3 colours)
Procedure
- Fold a large sheet in half again and again. Count your folds, then repeat with a thinner sheet.
- Each fold doubles the layers: 1, 2, 4, 8, 16 … Write the layers after each fold.
- Take the paper as 0.001 cm thick. Fill the table for folds 1 to 12 — each is the one before × 2.
- Carry the pattern on to 20, 27, 30 and 46 folds and note what the stack would reach.
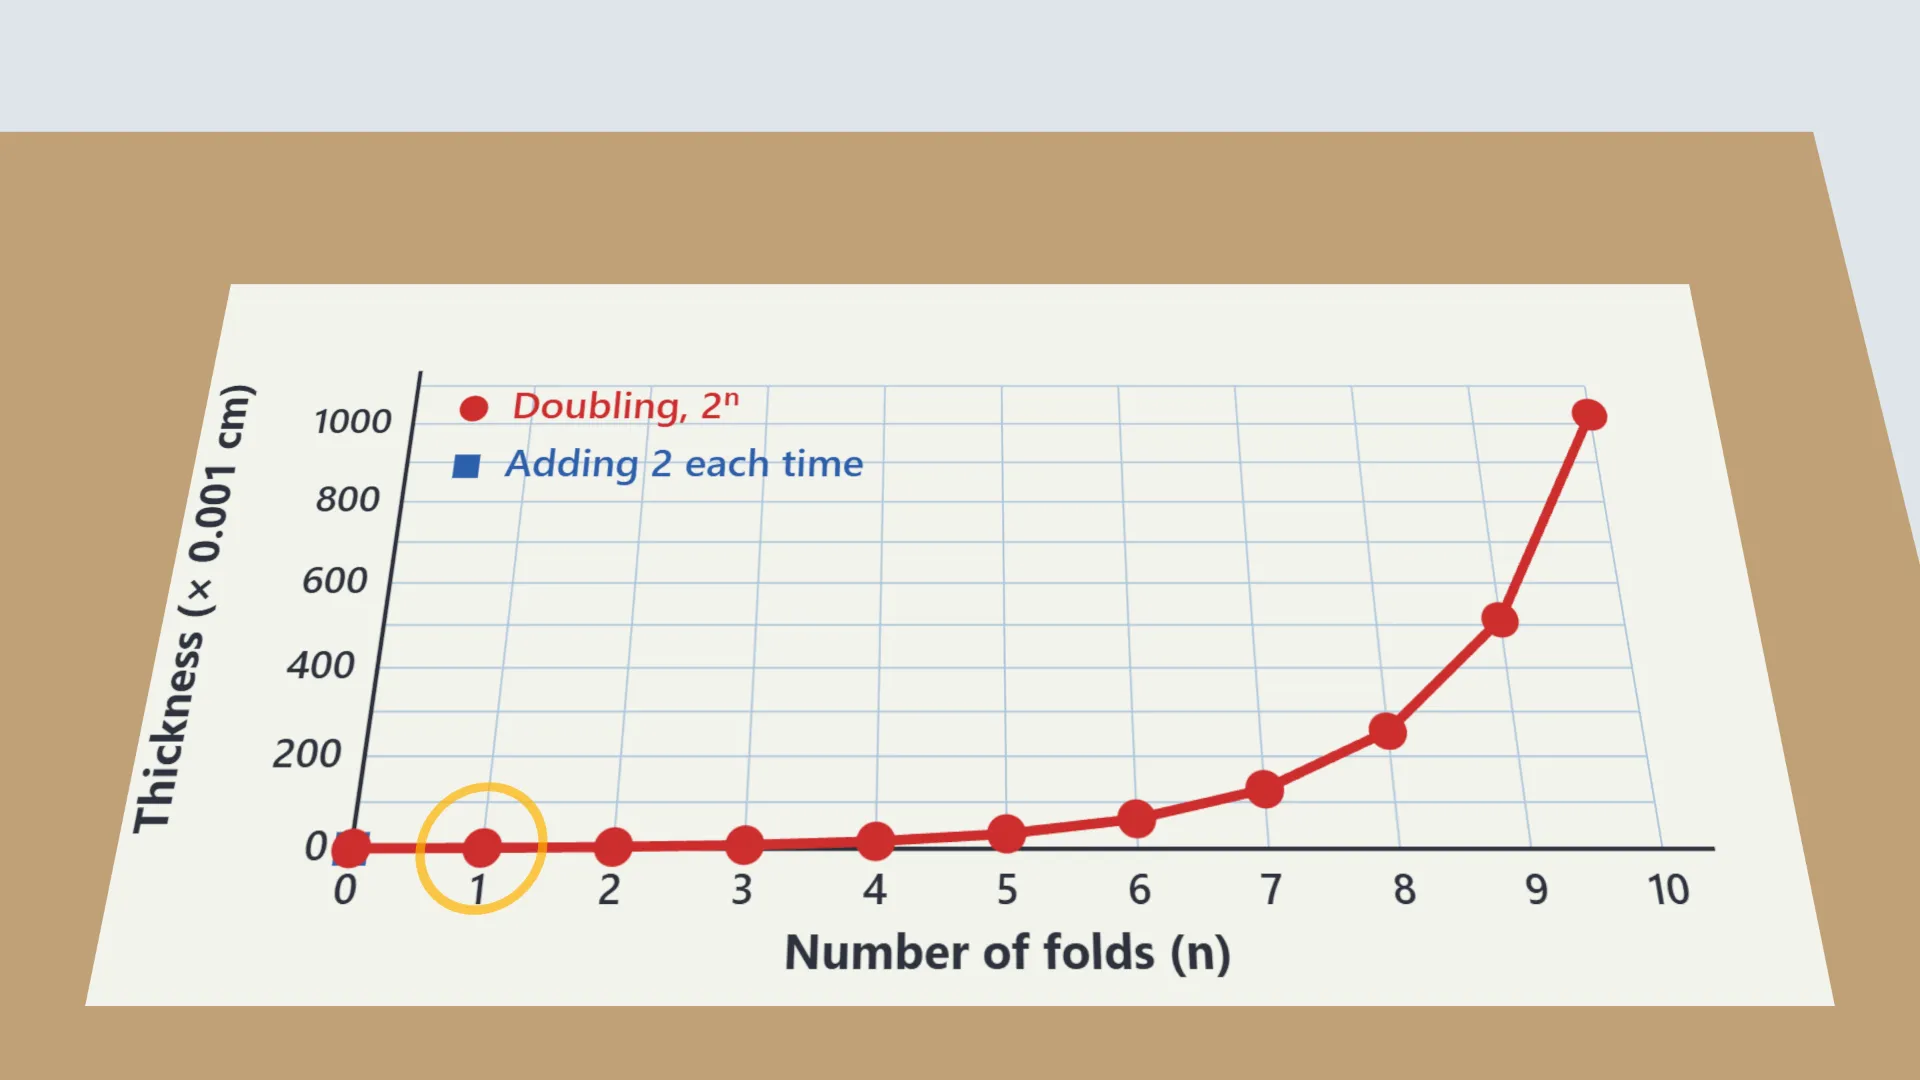
- On a graph, plot fold number against thickness for the first 10 folds. Describe the curve.
- On the same axes, plot a line that adds a fixed step each time. Which one overtakes the other?
Interactive 3D Experiment
Loading simulation…
What to observe
- The layers double at every fold: 2, 4, 8, 16, 32 … so after n folds there are 2ⁿ layers.
- Adding the same amount each time gives a straight line. Doubling gives a curve that stays low, then rises very steeply and overtakes the line.
- The paper cannot be folded more than about 6 or 7 times.
Notes
- Math Spark: people once believed paper could not be folded in half more than about 7 times. In 2002 a student, Britney Gallivan, folded a long sheet of tissue paper 12 times. Folded 46 times, a sheet 0.001 cm thick would reach beyond the Moon.
- Use large, thin paper. Thick paper cannot be folded enough times to show the pattern.
- Line up the edges before each fold and press the crease down firmly.
- Measure the whole folded stack, not a single sheet, and use the same ruler each time.
- Use the same scale on both axes when plotting the two graphs.
- Do not force a fold when the paper resists. Note the number of folds reached.
- Use the calculator only to check the table, after predicting each value yourself.