
How Crowded Is a Habitat? — Estimating Populations with a Quadrat
Aim
To estimate and compare the populations of different organisms in a fixed area using the quadrat method.
Apparatus
- A ball of string or thin rope
- Four wooden pegs or short sticks
- A metre scale or measuring tape
- Science notebook / lab record and pencil
- A magnifying lens to spot tiny organisms
Procedure
- Choose a patch of the school lawn. Work in groups, with your teacher.
- Measure a 1 m × 1 m square with the tape. Push a peg into each corner.
- Tie the string round the four pegs. This square is your quadrat.
- Look closely with the lens. Find four organisms — grass, a weed, ants and beetles.
- Count each organism inside the string, strip by strip. Do not count anything outside it.
- Record each count against the organism's name in the table.
- Move the quadrat to another spot and count again. Then find the average.
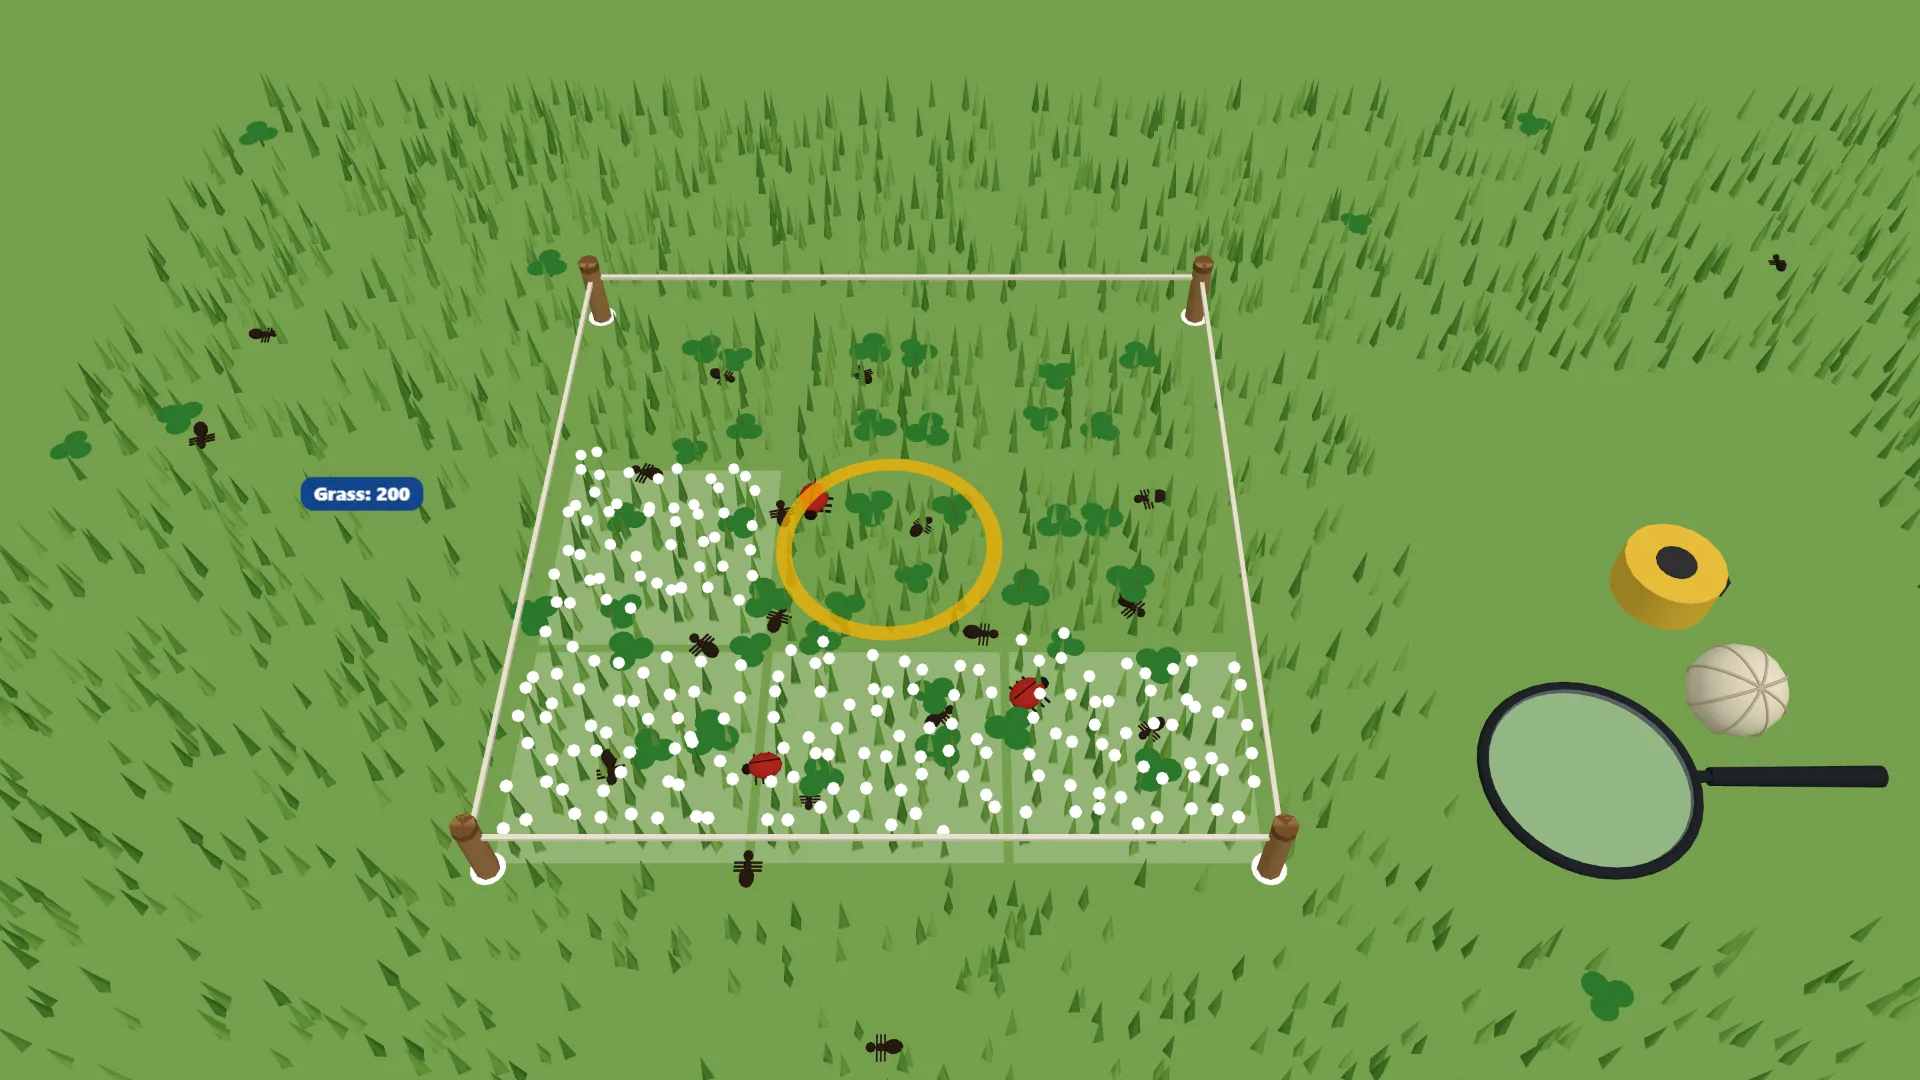
Interactive 3D Experiment
Loading simulation…
What to observe
- Grass has by far the largest population — hundreds of plants in one square metre.
- The weed (clover) comes next. Ants and beetles are far fewer.
- The two spots give slightly different counts, so we take the average.
Safety
- Work in groups, with the teacher, on a safe patch away from traffic, water and rubbish heaps.
- Keep the string taut, so the quadrat is a true 1 m × 1 m square. Measure it with the tape.
- Count only what is inside the string. Anything partly outside is not counted.
- Do not pull up plants or collect insects — count them where they are.
- Watch out for ants, bees, spiders and thorns. Do not put your hands into holes or under stones.
- Count slowly, strip by strip, so that nothing is counted twice or missed.
- Wash your hands after handling soil and plants.
Notes
- Did you know? India counts its wild tigers about once every four years — from pugmarks and, today, thousands of camera traps. The 2022 estimate crossed 3,600 tigers.
- The textbook leaves the table blank. The counts in the simulation are example values for a school lawn.