
Dot Plots, Median & Outliers
Aim
To organise data on a dot plot, find the median, identify outliers, and see how the mean and the median change when an outlier is present.
Apparatus
- Graph paper or pre-drawn number-line strips
- Ruler, pencil and coloured sketch pens
- Sticky notes or small counters to mark data points
Procedure
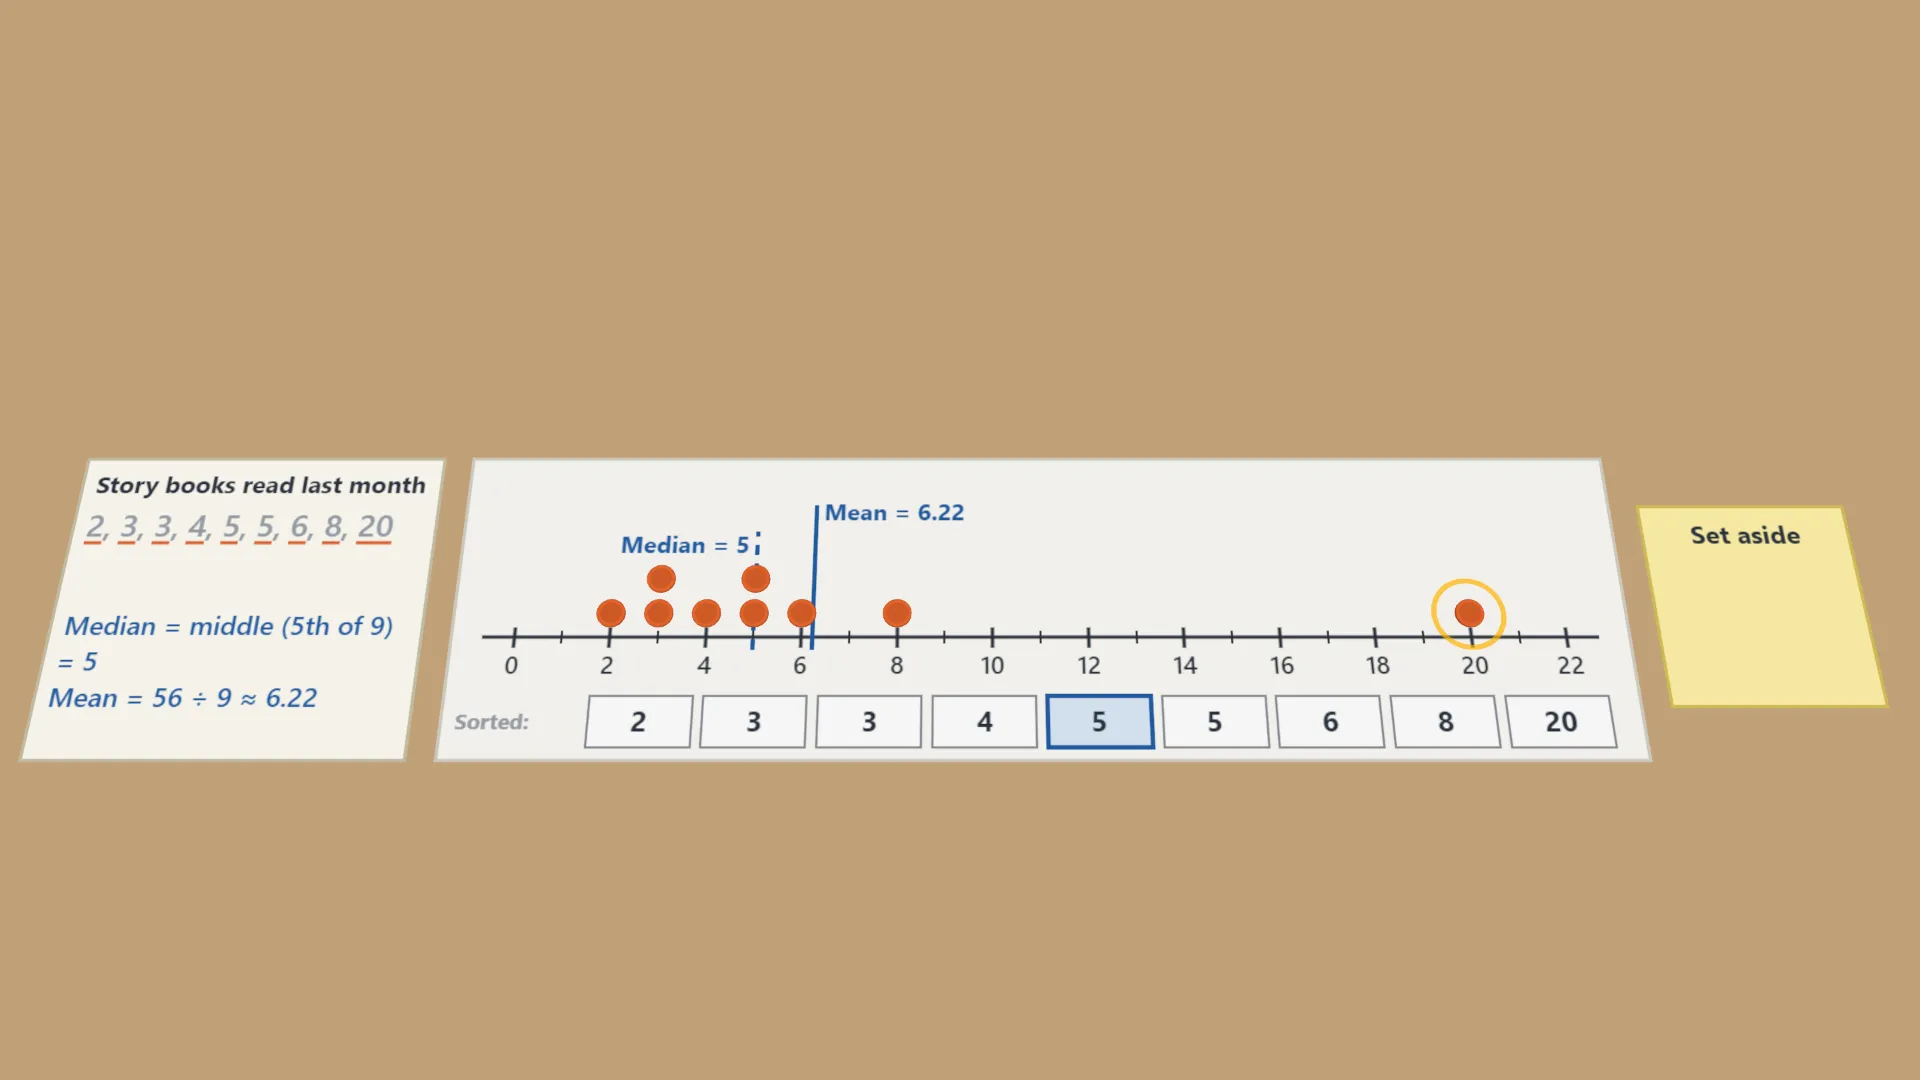
- Collect a data set: story books read by 9 members (Fig. 2.1); later, family heights and another set.
- Tap the number line at each value to place a dot. Stack dots when a value repeats.
- Tap the dot plot to sort the values. Tap the middle value — the median (even count, the two middle ones).
- Work out the mean. The mean (solid line) and the median (dashed line) are marked on the dot plot.
- Look for a value far from the rest — an outlier. Is it at the low or the high end?
- Drag the outlier off the line. Find the median and the mean again. What changes?
- Compare the sets: when is mean < median, mean > median, mean ≈ median?
Interactive 3D Experiment
Loading simulation…
What to observe
- Story books: median 5, mean 6.22. The outlier 20 pulls the mean above the median.
- Without 20 the mean falls to 4.5, but the median only moves from 5 to 4.5.
- Family heights have no outlier: mean 156.17 cm ≈ median 156.5 cm.
- An outlier at the low end (1) pulls the mean below the median: 11 < 13.
- The median is the middle value of ordered data. It is more reliable than the mean when there is an outlier.
Notes
- Math Spark: in a real Test innings many batters scored 0, so the median was 0 though the team scored 407. News reports use the median for incomes and house prices: a few huge values pull the mean up, not the median.
- Mark the number line with equal spacing before plotting any dots.
- Place one dot for each value, stacking repeats neatly in a straight column.
- Arrange the values in increasing order before picking out the median.
- When the number of values is even, take the average of the two middle values.
- Do not discard an outlier without a reason — record it and say how it affects the mean and the median.
- Recount the dots against the original data list before drawing conclusions.