
Constructing and Interpreting a Population Pyramid
Aim
To construct a population pyramid from age-sex data for India, and to read its shape to decide whether the population is young, stable or ageing.
Apparatus
- Graph paper
- Ruler and pencil
- Coloured pencils (one colour for males, another for females)
- The age-group percentage table for India (here, Census of India 2011)
- A calculator
Procedure
- Draw a vertical axis in the centre and mark the age groups (0–4 to 80+) from bottom to top.
- Mark a % scale on both sides of the axis, with 'Male' on the left and 'Female' on the right.
- For each age group, draw the male bar to the left and the female bar to the right.
- Shade the male bars in one colour and the female bars in another, and add a key.
- Compare the pyramid with the three shapes: wide-based triangle, bell, narrow-based top-heavy.
- Write a paragraph on which shape it resembles and what that says about India.
Interactive 3D Experiment
Loading simulation…
What to observe
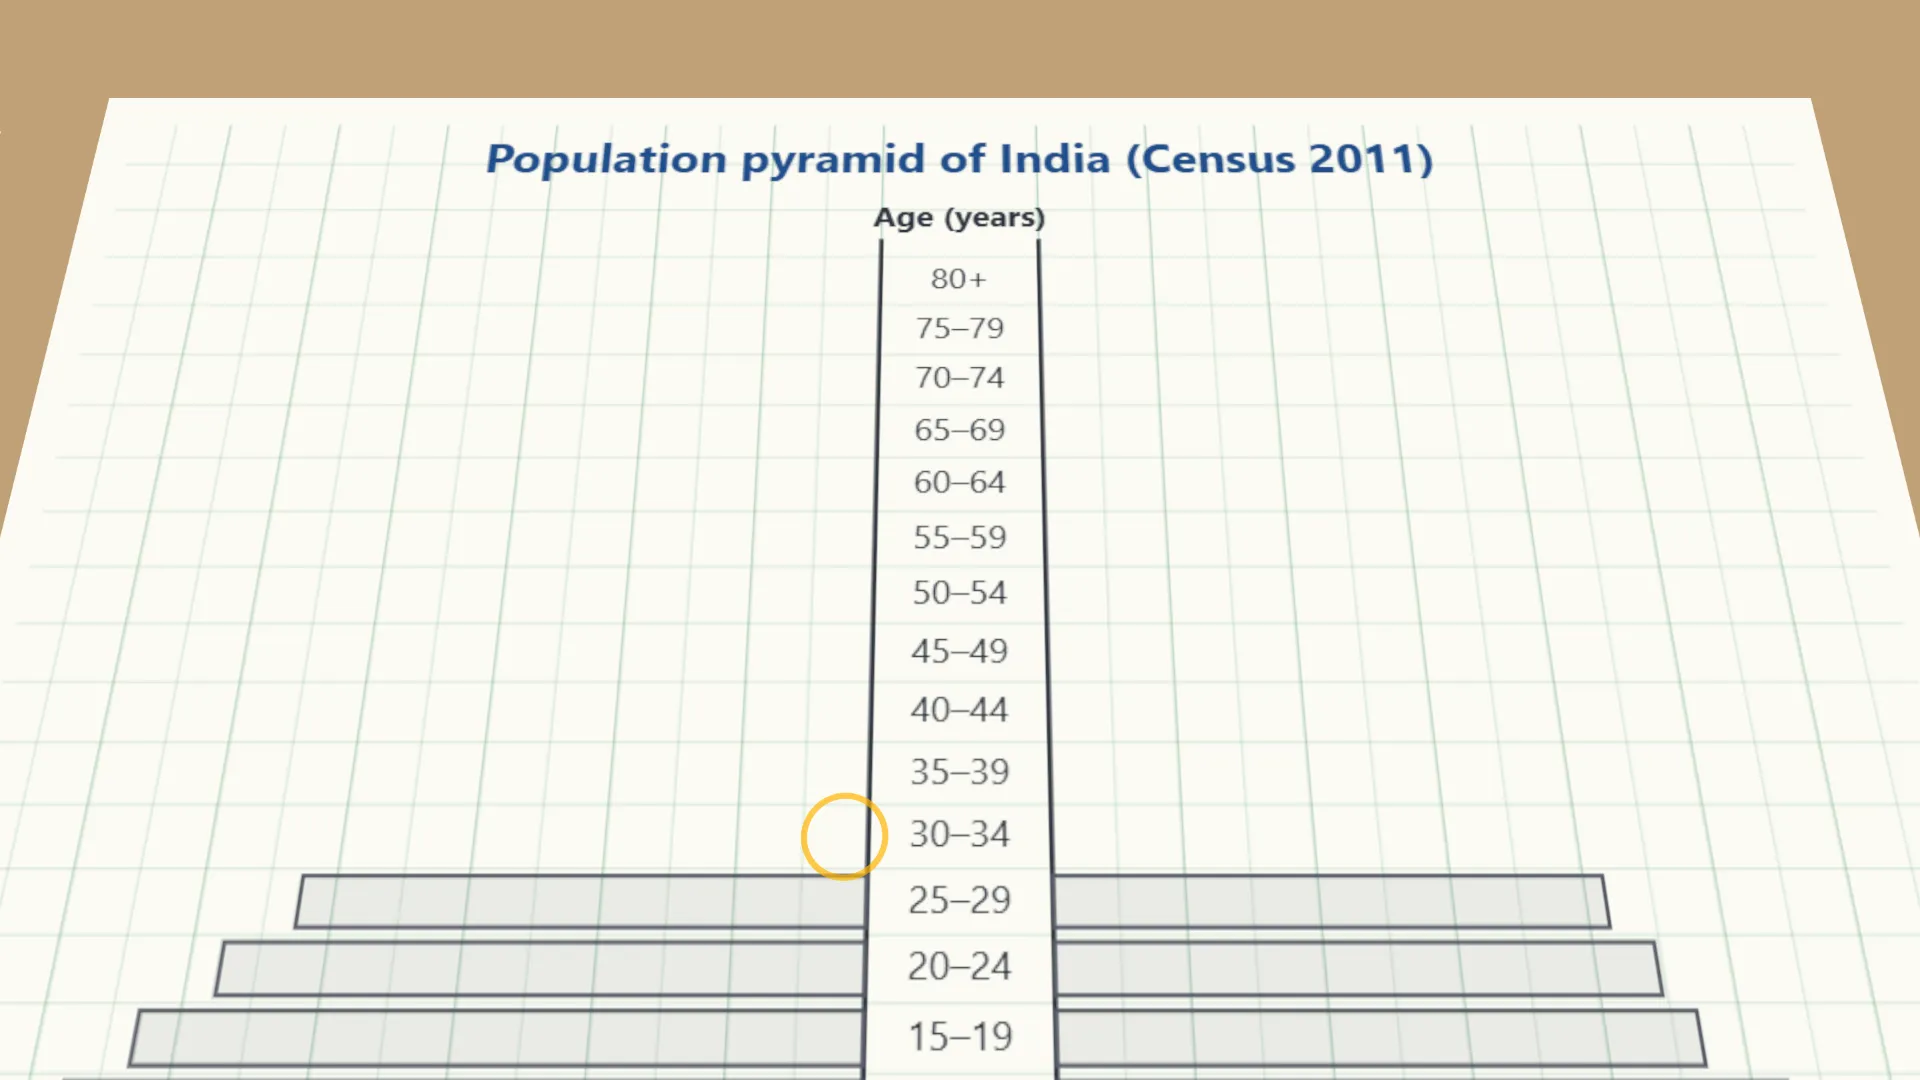
- The widest bars are near the bottom: about 31 in 100 Indians were under 15 in 2011.
- The top is narrow: only about 5 in 100 were 65 or older.
- The 0–4 bars are shorter than the 5–9 and 10–14 bars, a sign that births are falling.
Notes
- A population pyramid is shaped more like a triangle than a pyramid! A wide base means many children are being born; a wide middle means a large working-age group (India's 'demographic dividend'); a wide top means a large elderly population, as in Japan.
- Use the same horizontal scale on both the male and female sides, so the pyramid is not distorted.
- Label all axes clearly, with units.