
Comparing Population Density Using Data and Satellite Images
Aim
To calculate the population density of some places, classify them as high, medium or low density, and relate this to what satellite images show about rural and urban land use.
Apparatus
- Satellite-style views of a rural and an urban area (here, simple drawings, not photos)
- A calculator
- Population and area data (the lab manual's table; Census of India 2011 for the last two places)
- A ruler, an atlas and a notebook
Procedure
- Recall the formula: population density = total population ÷ area (sq km).
- For each place, divide its population by its area and round to the nearest whole number.
- Classify each place as High (above 5,000), Medium (1,000–5,000) or Low (below 1,000) density.
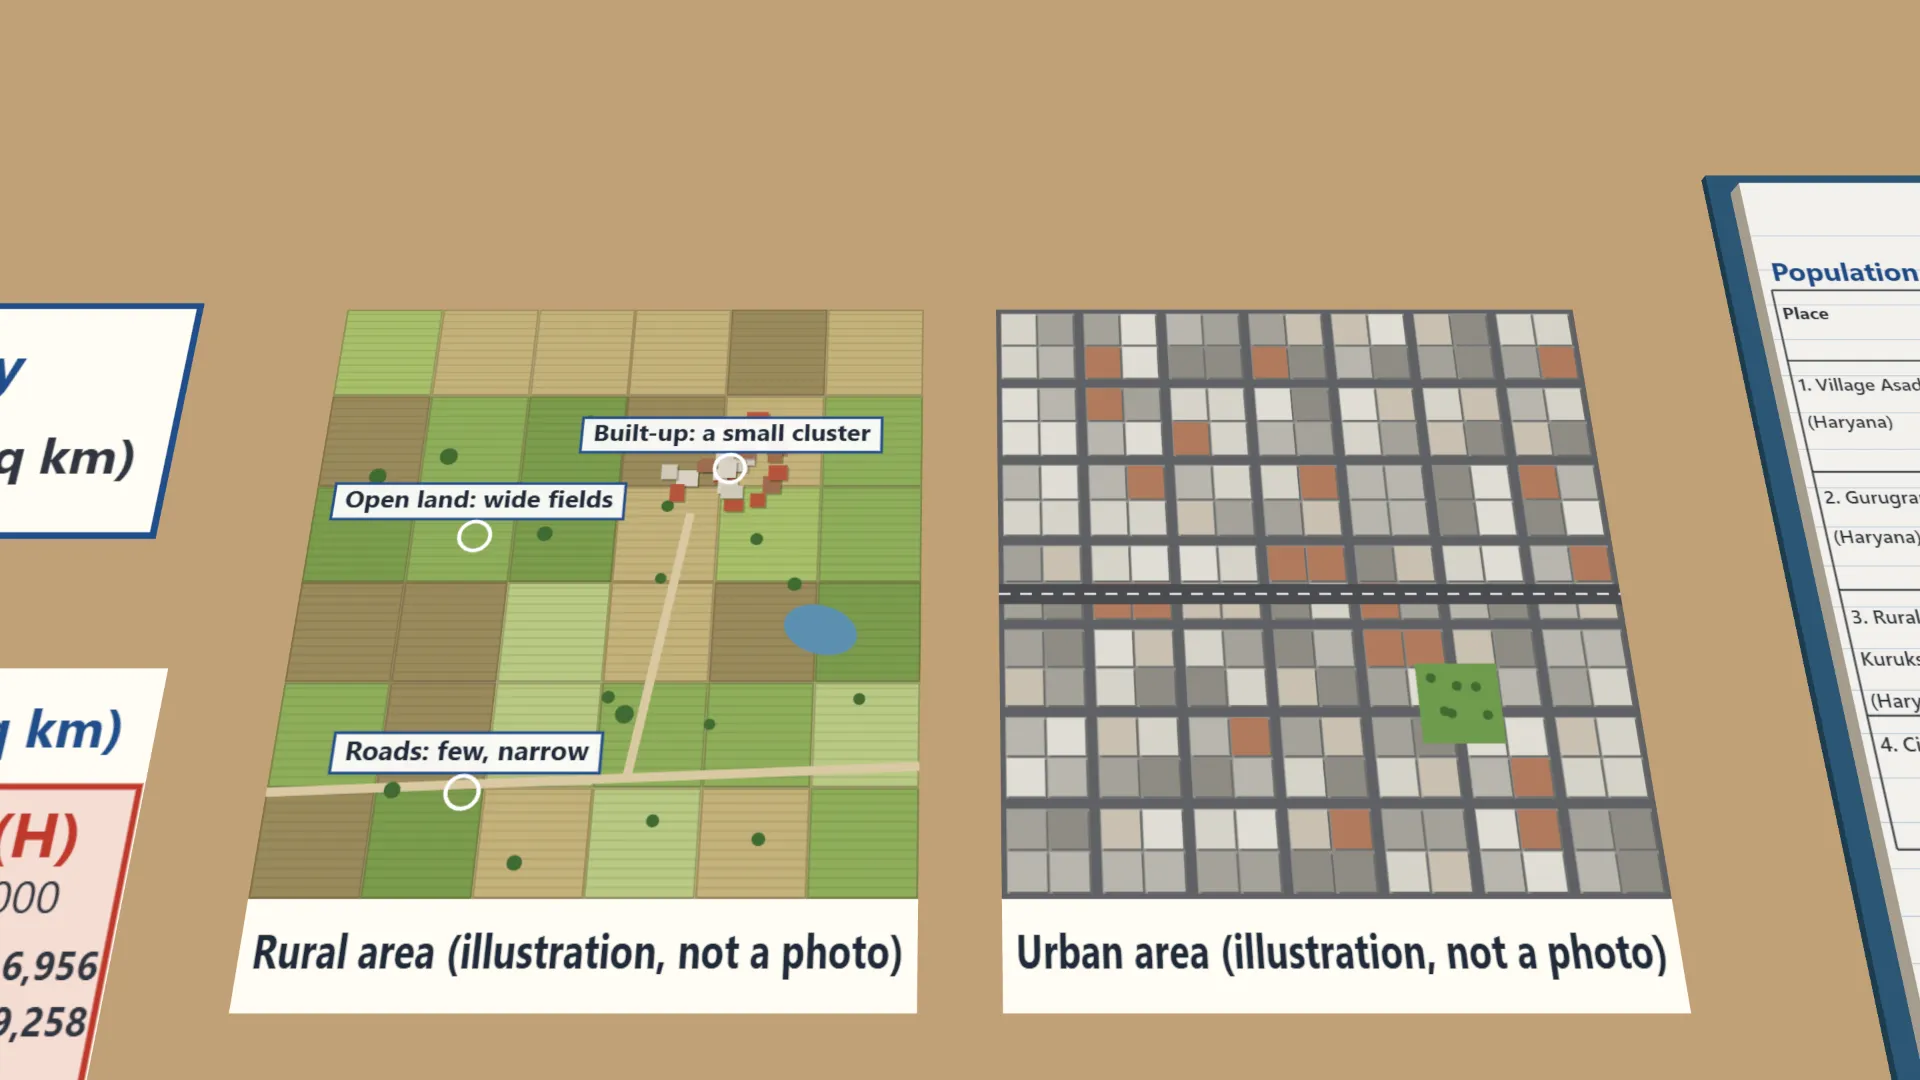
- Observe the rural and urban images. Note the built-up area, the open land and the roads.
- Match the images to your density results and explain in one or two sentences why the pattern occurs.
Interactive 3D Experiment
Loading simulation…
What to observe
- Asadpur Khera village: 6,200 ÷ 9.5 ≈ 653 persons per sq km (Low). Gurugram city: 1,153,000 ÷ 68 ≈ 16,956 (High).
- The rural image has a few houses in a small cluster, wide open fields and only a few narrow roads.
- The urban image has buildings on almost all the land, very little open land and a dense grid of roads.
- Places with low density look rural; places with high density look urban.
Notes
- By 2050, about 68% of the world's people will live in cities, up from 55% today. In India, the urban share grew from about 17% in 1951 to around 36% in 2025: more than one in three Indians now lives in a town or city.
- Keep the units the same (sq km throughout) before dividing, and round each density to the nearest whole number.
- Handle printed images carefully and return them undamaged.