
Comparing Demographic Indicators Across Countries
Aim
To compare the fertility rate, life expectancy and median age of two countries, and to relate the differences to their stage of demographic transition.
Apparatus
- Reference data for the countries (here, UN World Population Prospects 2024, estimates for 2023)
- The stages of demographic transition (Stage 1, 2 and 3)
- Chart paper and coloured pens
- A notebook
Procedure
- Choose two countries to compare, for example India and Japan, or Nigeria and Italy.
- Record each country's population, fertility rate, life expectancy and median age in the table.
- From the birth and death rates, place each country in Stage 1, 2 or 3 of demographic transition.
- Discuss the reasons for the differences, such as healthcare, education, women's work and policies.
- Make a two-country chart of the indicators, the stage of each country and the likely reasons.
- Present the chart and note one challenge each country may face from its population structure.
Interactive 3D Experiment
Loading simulation…
What to observe
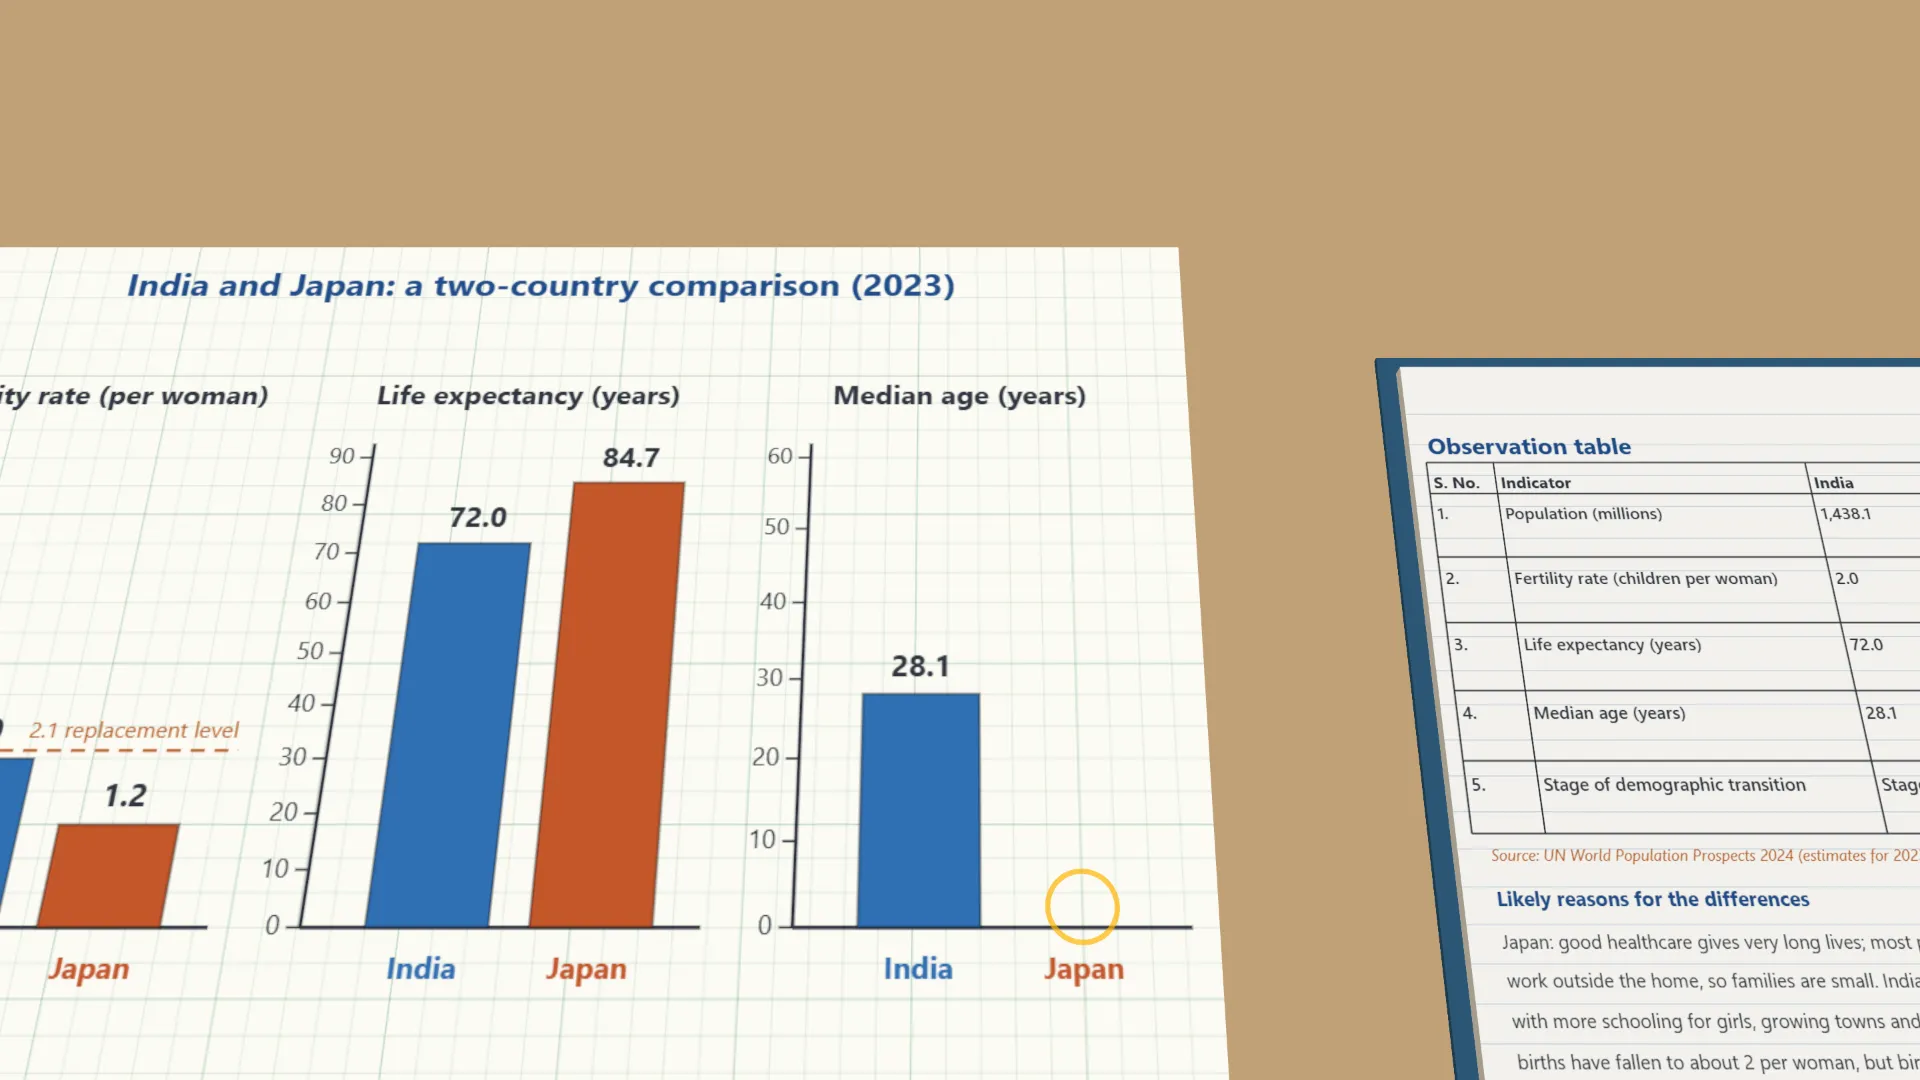
- India has about 2.0 children per woman and a median age of 28; Japan has 1.2 children per woman and a median age of 49.
- Japan and Italy have more deaths than births, so their populations are shrinking (Stage 3).
- India's and Nigeria's births are still more than twice their deaths, so their populations still grow (Stage 2).
Notes
- A fertility rate of 2.1 is called the 'replacement level': the number of children needed, on average, to keep a population stable from one generation to the next. Below this level, a population eventually starts to shrink, as is happening in Japan, Italy and China.
- Use only the figures provided in the chapter or by the teacher, and clearly cite the source of each figure in the chart.