
Collecting and Organising Data
Aim
Collect data with a simple class survey, then organise the answers with tally marks in a frequency table, so that questions about the data are easy to answer.
Apparatus
- Notebook or chart paper and a pencil
- Ruler and coloured pens or sketch pens
- A short list of survey questions (favourite game, favourite colour, shoe size, etc.)
- The whole class as respondents
Procedure
- Choose one question to ask, such as “Which is the most popular sweet in our class?”
- Ask every classmate the question. Write each answer exactly as it is given.
- The raw list is hard to read. Write each different sweet in the first column of a table.
- For each answer, put a tally mark next to its sweet. The fifth mark strikes across the four.
- Count each sweet's tallies and write its frequency in the last column.
- Add the frequencies. The total must equal the number of students asked.
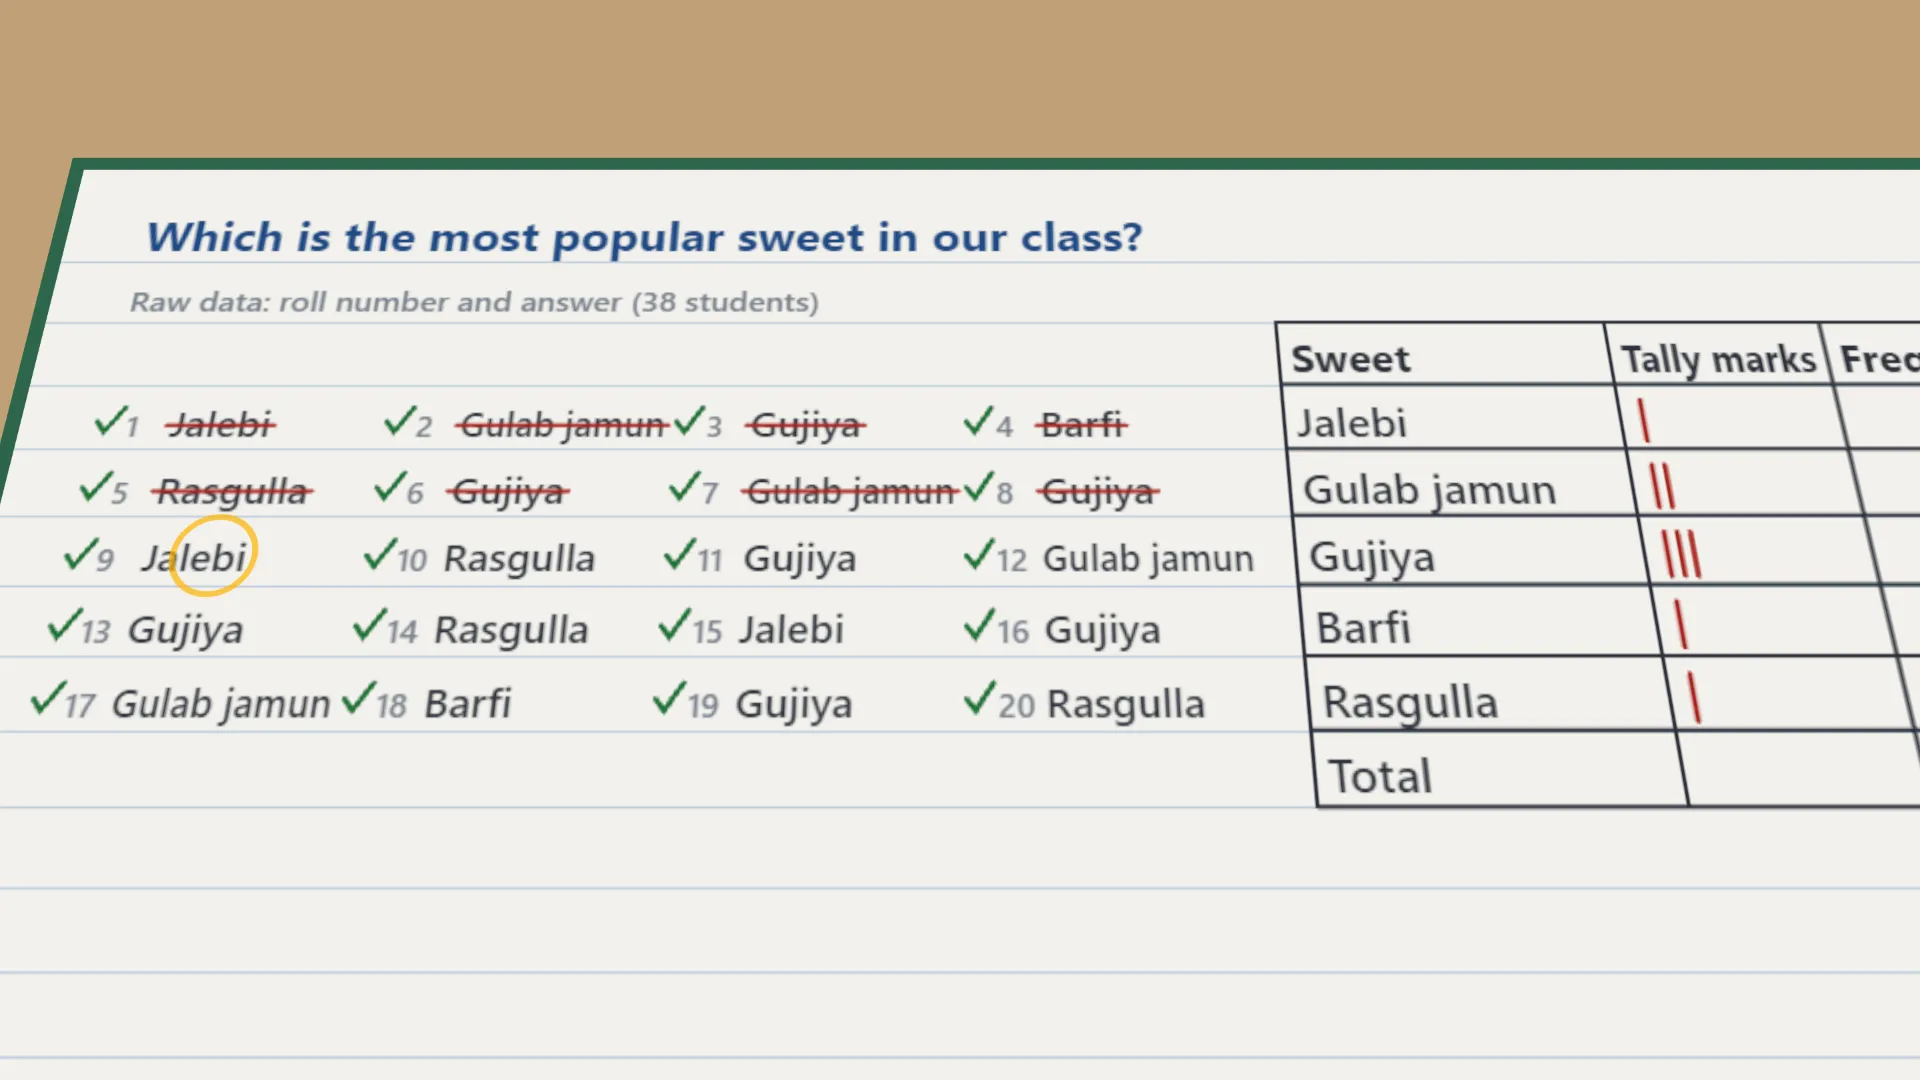
Interactive 3D Experiment
Loading simulation…
What to observe
- Which is easier to read, the raw list of answers or the tally table?
- Which sweet is the most popular in the class? Which is the least popular?
- Does the total of the frequencies equal the number of students asked?
Notes
- The word data comes from the Latin datum, “something given”. One piece of information is a datum; many together are data.
- Tally marks are one of the oldest ways of counting. Tally sticks with notches more than 40,000 years old have been found, from long before written numbers.
- Ask every classmate exactly the same question, in the same words.
- Write down each answer just as it is given. Do not change, guess or “correct” it.
- Ask each person only once and tick their name off, so no one is counted twice or left out.
- Make the fifth tally mark a line across the four before it. Never write five or six upright marks.
- Put every answer against the right sweet. If an answer fits no sweet in the table, add a new row.
- Check that the frequencies add up to the number of people asked before you draw conclusions.